
GLOBAL ENERGY
TRANSFORMATION

© IRENA 2018
Unless otherwise stated, material in this publication may be freely used, shared, copied, repro-
duced, printed and/or stored, provided that appropriate acknowledgement is given of IRENA
as the source and copyright holder. Material in this publication that is attributed to third parties
may be subject to separate terms of use and restrictions, and appropriate permissions from
these third parties may need to be secured before any use of such material.
ISBN 978-92-9260-059-4
About IRENA
The International Renewable Energy Agency (IRENA) is an intergovernmental organisation that supports countries in their
transition to a sustainable energy future, and serves as the principal platform for international co-operation, a centre of
excellence, and a repository of policy, technology, resource and financial knowledge on renewable energy. IRENA pro-
motes the widespread adoption and sustainable use of all forms of renewable energy, including bioenergy, geothermal,
hydropower, ocean, solar and wind energy in the pursuit of sustainable development, energy access, energy security and
low-carbon economic growth and prosperity. www.irena.org
Acknowledgements
Valuable external review was provided by Martha Ekkert & Martin Schöpe (BMWi), Morgan Bazilian (Colorado School of
Mines), Kim Møller Porst (EFKM), Luiz Barroso & Rafael de Sá Ferreira (EPE), Wang Zhongying (ERI), Andreas Kraemer
(IASS), Laura Cozzi, Paolo Frankl, Timur Gul & Andrew Prag (IEA), Doug Arent & Jeff Logan (NREL), Mauricio Tolmasquim
(PPE), and Ben King & Paul Spitsen (US DOE).
The authors would like to extend a special thanks to Deger Saygin (SHURA Energy Transition Centre).
Valuable review and feedback was provided by IRENA colleagues Ahmed Abdel-Latif, Yong Chen, Bowen Hong, Paul Komor,
Divyam Nagpal, Thomas Nikolakakis, Asami Miketa, Elizabeth Press, Hameed Safiullah, Emanuele Talbi, Michael Taylor, and
Henning Wuester. The editor of this report was Robert Archer.
Consultants for REmap who assisted in preparation of this report include Toby Couture, David Jacobs and Owen Zinaman.
The macro-economic modelling (E3ME) results were provided by Hector Pollitt, Jon Stenning, Eva Alexandri, Stijn Van
Hummelen, Unnada Chewpreecha, and other team members of Cambridge Econometrics, UK.
Contributing authors: This report was prepared by the REmap team at IRENA’s Innovation and Technology Centre (IITC)
and Policy Team at IRENA’s Knowledge, Policy and Finance Centre (KPFC). The REmap analysis and sections were authored
by Dolf Gielen, Ricardo Gorini, Nicholas Wagner, Rodrigo Leme, Laura Gutierrez & Gayathri Prakash, with additional
contributions and support by Paul Durrant, Luis Janeiro & Jennifer Winter. The socio-economic analysis and sections were
authored by Xavier Casals, Bishal Parajuli, Michael Renner, Sandra Lozo, Arslan Khalid, Álvaro López-Peña and Rabia Ferroukhi.
IRENA is grateful for the generous support of the Federal Ministry for Economic Affairs and Energy of Germany, which made
the publication of this report a reality.
Report citation
IRENA (2018), Global Energy Transformation: A roadmap to 2050, International Renewable Energy Agency, Abu Dhabi.
This report is available for download from www.irena.org/publications. For further information or to provide feedback,
please contact IRENA at info@irena.org
Disclaimer
This publication and the material herein are provided “as is”. All reasonable precautions have been taken by IRENA to
verify the reliability of the material in this publication. However, neither IRENA nor any of its officials, agents, data or other
third-party content providers provides a warranty of any kind, either expressed or implied, and they accept no responsi-
bility or liability for any consequence of use of the publication or material herein.
The information contained herein does not necessarily represent the views of the Members of IRENA. The mention of
specific companies or certain projects or products does not imply that they are endorsed or recommended by IRENA
in preference to others of a similar nature that are not mentioned. The designations employed and the presentation of
material herein do not imply the expression of any opinion on the part of IRENA concerning the legal status of any region,
country, territory, city or area or of its authorities, or concerning the delimitation of frontiers or boundaries.
2

A Renewable Energy Roadmap
FOREWORD
In an era of accelerating change, the imperative to limit climate change and achieve sustainable
growth is strengthening the momentum of the global energy transformation. The rapid decline
in renewable energy costs, improving energy efficiency, widespread electrification, increasingly
“smart” technologies, continual technological breakthroughs and well-informed policy making
all drive this shift, bringing a sustainable energy future within reach.
While the transformation is gaining momentum, it must happen faster. Around two-thirds of
global greenhouse gas emissions stem from energy production and use, which are at the core
of efforts to combat climate change. To meet climate goals, progress in the power sector needs
to accelerate further, while the decarbonisation of transport and heating must pick up steam.
As this report makes clear, current and planned policies offer a comparatively slow path,
whereby the world would exhaust its energy-related “carbon budget” in under 20 years, in
terms of efforts to keep the global temperate rise well below 2°C. The budget for a 1.5°C limit,
meanwhile, would potentially run out in less than a decade.
The energy system, consequently, requires rapid, immediate and sustained change. The
deployment of renewables must increase at least six-fold compared to the levels set out in
current plans. The share of electricity in total energy use must double, with substantial
electrification of transport and heat. Renewables would then make up two-thirds of energy
consumption and 85% of power generation. Together with energy efficiency, this could deliver
over 90% of the climate mitigation needed to maintain a 2°C limit.
Fortunately, this is also the path of opportunity. It would enable faster growth, create more jobs,
create cleaner cities and improve overall welfare. In economic terms, reducing human health
and environmental costs would bring annual savings by 2050 up to five times the additional
annual cost of the transition. The global economy in 2050 would be larger, with nearly 40 million
jobs directly related to renewables and efficiency. Timely action would also avoid stranding over
USD 11 trillion worth of energy-infrastructure assets that are tied to today’s polluting energy
technologies.
Along with analysing options, this report examines the socio-economic footprint of the shift
to renewables, providing insights into how to optimise the outcome. Policies to promote a just
and fair transition can maximise the benefits for different countries, regions and communities.
Transforming the global energy system would permit affordable, and universal, energy access,
increase energy security, and diversify energy supply.
The world’s actions today will be crucial to create a sustainable energy system. Ultimately, the
path to secure a better future depends on pursuing a positive, inclusive, economically, socially
and environmentally beneficial energy transformation.
Adnan Z. Amin
Director-General, IRENA
Foreword
3
4

CONTENTS
Executive Summary ......................................................................... 08
Introduction
...................................................................................16
Status of the energy transition: A mixed picture
................................................18
Energy-related carbon dioxide emissions: Bridging the gap
.................................... 21
A pathway for the transformation of the global energy system
................................ 23
Country ambition for the energy transition
.................................................... 28
Analysis and insights in key sectors
............................................................31
Transport ............................................................................... 31
Buildings ............................................................................... 33
Industry ............................................................................... 36
Power ................................................................................. 38
Costs, investments and reduced externalities of the energy transition
........................41
Socio-economic benefits of the energy transition
..............................................44
Global GDP ..............................................................................47
Employment in the global economy ....................................................... 49
Global energy sector employment ......................................................... 51
Global welfare .......................................................................... 54
Regional GDP, employment, welfare ....................................................... 57
How finance affects the energy transition .................................................. 62
Key socio-economic messages ........................................................... 65
How to foster the global energy transformation: Key focus areas
.............................. 68
Focus Area 1. Tap into the strong synergies between energy efficiency and renewable energy. ... 69
Focus Area 2. Plan a power sector for which renewables provide a high share of the energy ..... 70
Focus Area 3. Increase use of electricity in transport, building and industry. ................... 70
Focus Area 4. Foster system-wide innovation. ............................................... 71
Focus Area 5. Align socio-economic structures and investment with the transition. .............. 71
Focus Area 6. Ensure that transition costs and benefits are fairly distributed. .................. 72
References
................................................................................... 74
5

FIGURES
Figure 1. In under 20 years the global energy-related CO
2
emissions
budget to keep warming below 2°C would be exhausted
........................... 21
Figure 2. Renewable energy and energy efficiency can provide over 90%
of the reduction in energy-related CO
2
emissions ...................................22
Figure 3. The global share of renewable energy would need to increase to
two-thirds and TPES would need to remain flat over the period to 2050
............23
Figure 4. The rising importance of electricity derived from renewable energy .................24
Figure 5. Significant improvements in energy intensity are needed and
the share of renewable energy must rise
............................................25
Figure 6. Renewable energy should be scaled up to meet power, heat and transport needs .....26
Figure 7. The declining importance of fossil fuels .............................................27
Figure 8. A rapid and significant decline in energy-related CO
2
emissions
is necessary in all countries
.........................................................29
Figure 9. Transforming energy demand in the transport sector ............................... 31
Figure 10. Infographic transport ..............................................................32
Figure 11. The increasing use of electricity in buildings and the decline of fossil fuels. ..........34
Figure 12. Infographic buildings ...............................................................35
Figure 13. A diverse energy mix with sizable bioenergy demand ...............................36
Figure 14. Infographic industry ................................................................37
Figure 15. The rising importance of solar and wind energy in the power sector .................39
Figure 16. Infographic power ................................................................. 40
Figure 17. Investment will need to shift to renewable energy and energy efficiency ............ 41
Figure 18. Reduced externalities far outweigh the costs of the energy transition ...............42
Figure 19. Obtaining the socio-economic footprint from a given combination of an energy
transition roadmap and a socio-economic system structure and outlook ............44
Figure 20. The energy transition results in GDP growth higher than the Reference Case
between 2018 and 2050
............................................................47
Figure 21. The energy transition results in employment growth higher than
the Reference Case between 2018 and 2050
........................................49
Figure 22. The energy transition would generate over 11 million additional energy
sector jobs by 2050
................................................................52
Figure 23. The energy transition would generate 14 million additional jobs in renewable
energy by 2050
....................................................................53
Figure 24. Components of the welfare indicator used in this analysis ...........................54
Figure 25. The energy transition generates significant increases in global welfare ..............55
Figure 26. Impact of the energy transition on GDP .............................................57
Figure 27. Impact of the energy transition on welfare ..........................................58
Figure 28. Impact of the energy transition on employment ....................................58
Figure 29. Crowding out of capital does affect employment, but the energy transition
still generates positive employment growth
.........................................64
Figure 30. Planning for the energy transition. . . . . . . . . . . . . . . . . . . . . . . . . . . . . . . . . . . . . . . . . . . . . . . . . . .68
6

TABLES ABBREVIATIONS
Table 1. Key indicators relevant to the
energy transition in selected countries
(REmap Case)
.....................................30
°C degrees Celsius
CCS carbon capture and storage
CHP combined heat and power
CO
2
carbon dioxide
CPI Climate Policy Institute
CSP concentrated solar power
EJ exajoule
EU European Union
EV electric vehicle
G20 Group of Twenty
GDP gross domestic product
GHG greenhouse gas
Gt gigaton
GW gigawatt
GWth gigawatt thermal
ICT information and
communicating technologies
IEA International Energy Agency
incl. including
IRENA International Renewable
Energy Agency
km kilometre
kWh kilowatt-hour
LBNL Lawrence Berkeley National Laboratory
m
2
square metre
m
3
metre cubed
MJ megajoules
N/A not applicable
NDCs Nationally Determined
Contributions
OPEC Organization of the Petroleum
Exporting Countries
PJ petajoule
PV photovoltaic
R&D research and development
RD&D research, development, and
demonstration
REmap renewable energy roadmap
SDG Sustainable Development Goals
SE4ALL Sustainable Energy for All
T&D transmission and distribution
TFEC total final energy consumption
TPES total primary energy supply
TWh terawatt-hour
UN the United Nations
USA United States of America
USD United States Dollar
VRE variable renewable energy
yr year
BOXES
BOX 1 - This report and its focus .................................18
BOX 2 - Energy access and the transition ...................... 45
BOX 3 - Addressing fossil fuel export dependency
and other transition challenges
.........................61
7
The historic climate accord from 2015 seeks, at minimum, to limit average global temperature
rise to “well below 2°C” in the present century, compared to pre-industrial levels. Renewables, in
combination with rapidly improving energy efficiency, form the cornerstone of a viable climate
solution.
Keeping the global temperature rise below 2 degrees Celsius (°C) is technically feasible.
It would also be more economically, socially and environmentally beneficial than the path
resulting from current plans and policies. However, the global energy system must undergo a
profound transformation, from one largely based on fossil fuels to one that enhances efficiency
and is based on renewable energy. Such a global energy transformation – seen as the culmination
of the “energy transition” that is already happening in many countries – can create a world that is
more prosperous and inclusive.
Currently, emission trends are not on track to meet that goal. Government plans still fall far
short of emission reduction needs. Under current and planned policies, the world would exhaust its
energy-related “carbon budget” (CO
2
) in under 20 years to keep the global temperate rise to well
below 2°C (with 66% probability), while fossil fuels such as oil, natural gas and coal would continue
to dominate the global energy mix for decades to come.
To meet the below 2°C goal, immediate action will be crucial. Cumulative emissions must at
least be reduced by a further 470 gigatons (Gt) by 2050 compared to current and planned policies
(business-as-usual) to meet that goal.
Renewable energy needs to be scaled up at least six
times faster for the world to start to meet the goals
set out in the Paris Agreement.
EXECUTIVE SUMMARY
EXECUTIVE SUMMARY
8
EXECUTIVE SUMMARY
Energy efficiency and renewable energy are the main pillars of the energy transition. While
different paths can mitigate climate change, renewable energy and energy efficiency provide
the optimal pathway to deliver the majority of the emission cuts needed at the necessary speed.
Together they can provide over 90% of the energy-related CO
2
emission reductions that are
required, using technologies that are safe, reliable, affordable and widely available.
Renewable energy and energy efficiency need to expand in all sectors. The total share of
renewable energy must rise from around 15% of the total primary energy supply (TPES) in 2015 to
around two-thirds by 2050. To meet climate targets, the energy intensity of the global economy
will need to fall by about two-thirds by 2050, lowering the total primary energy supply in that year
to slightly less than 2015 levels. This can be achieved, despite significant population and economic
growth, by substantially improving energy efficiency.
By 2050, all countries can substantially increase the proportion of renewable energy in their
total energy use. REmap, a global roadmap prepared by the International Renewable Energy
Agency (IRENA), suggests that renewables can make up 60% or more of many countries’ total final
energy consumption (TFEC). For instance, China could increase the share of renewable energy in
its energy use from 7% in 2015 to 67% in 2050. In the European Union (EU), the share could grow
from about 17% to over 70%. India and the United States could see shares increase to two-thirds
or more.
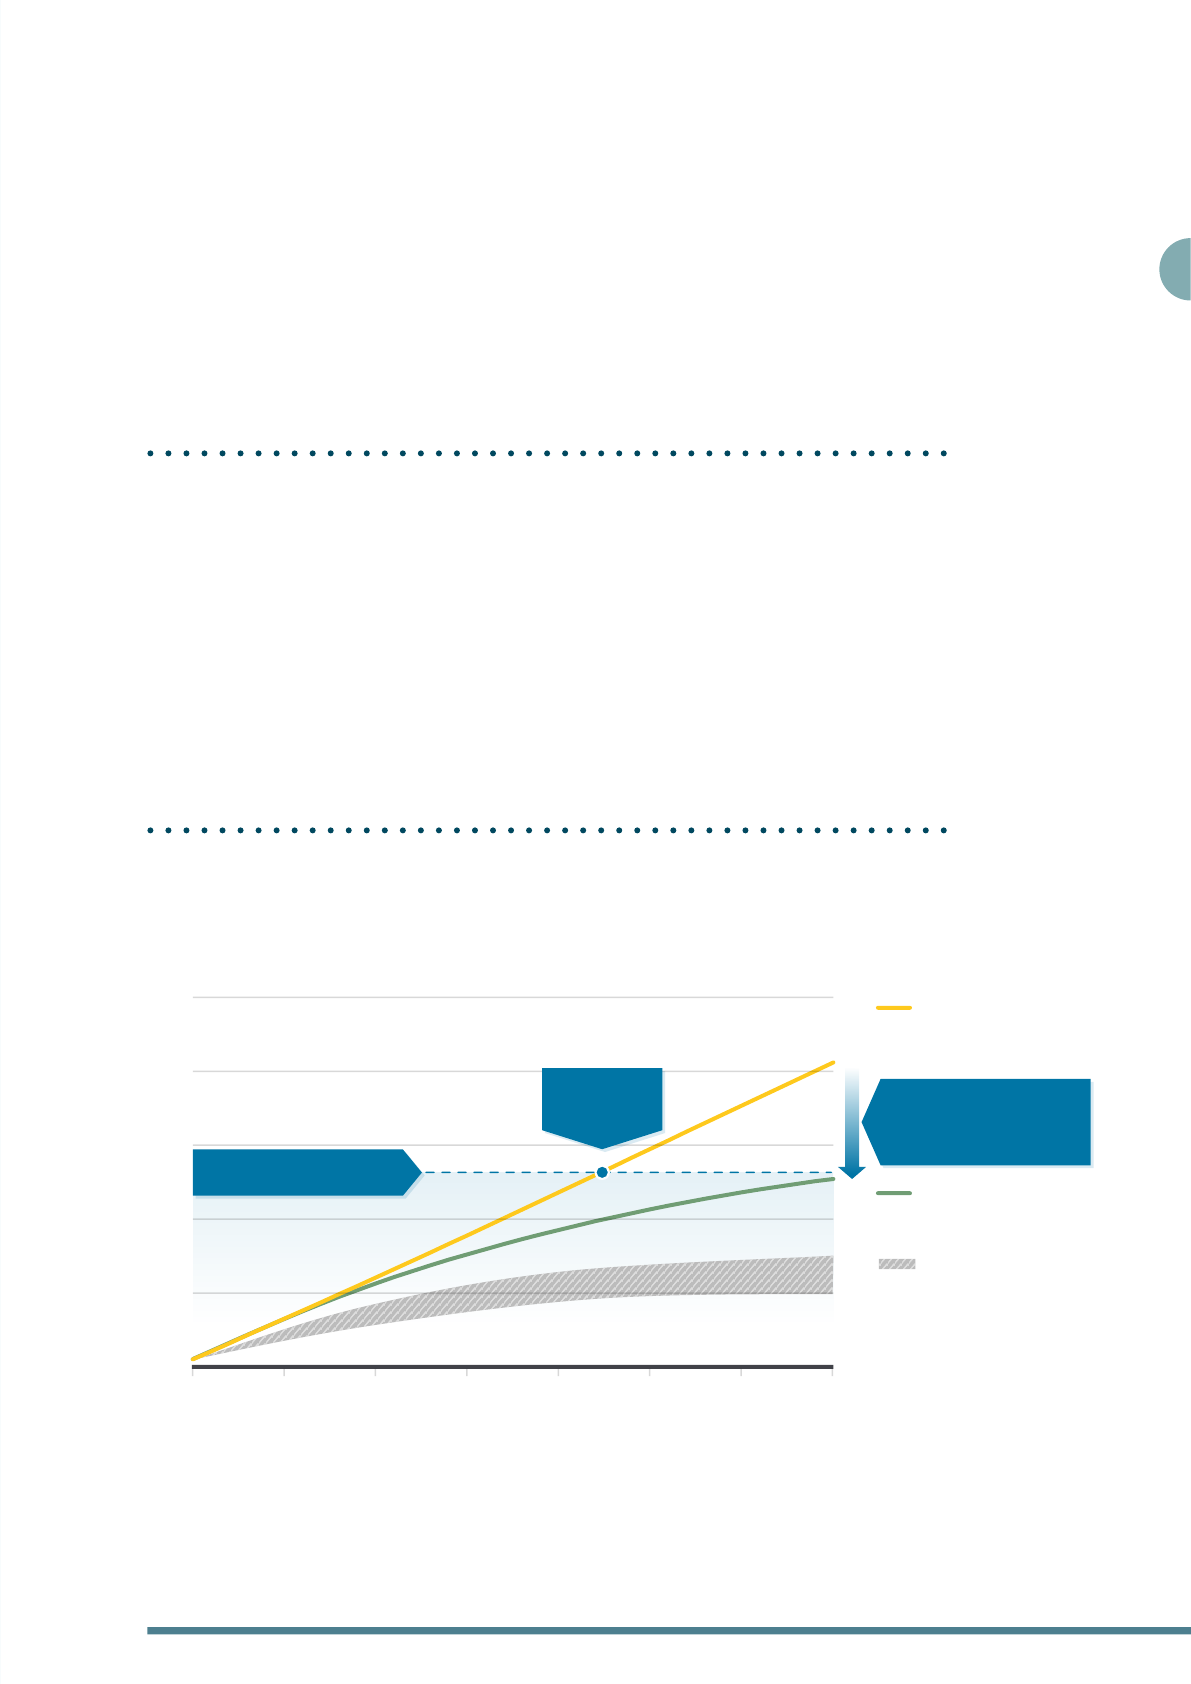
Figure ES1. In under 20 years, the global energy-related CO
2
emissions budget to keep warming
below 2°C would be exhausted
Cumulative energy-related CO
2
emissions and emissions gap, 2015-2050 (Gt CO
2
)
0
300
600
900
1 200
1 500
20502045204020352030202520202015
Reference Case: 2.6°C – 3.0°C
Cumulative CO by 2050: 1 230 Gt
Annual CO in 2050: 34.8 Gt/yr
50% 1.5°C
Energy sector CO budget:
2015 - 2100: 300-450 Gt
Net annual CO
emissions
in 2050: 0 Gt/yr
REmap Case: 66% <2°C
Cumulative CO by 2050: 760 Gt
Annual CO in 2050: 9.7 Gt/yr
Energy-related CO budget
66% <2°C 2015-2100: 790 Gt
2037:
CO budget
exceeded
Reductions in REmap Case
compared to Reference Case
Cumulative by 2050: -470 Gt
Annual in 2050: -25.1 Gt/yr
Cumulative energy-related carbon emissions (Gt CO)
9
A decarbonised power sector, dominated by renewable sources, is at the core of the transition
to a sustainable energy future. The share of renewable energy in the power sector would increase
from 25% in 2017 to 85% by 2050, mostly through growth in solar and wind power generation.
This transformation would require new approaches to power system planning, system and
market operations, and regulation and public policy. As low-carbon electricity becomes the main
energy carrier, the share of electricity consumed in end-use sectors would need to double from
approximately 20% in 2015 to 40% in 2050. Electric vehicles (EVs) and heat pumps would become
more common in most parts of the world. In terms of final energy, renewable electricity would
provide just under 60% of total renewable energy use, two and a half times its contribution to
overall renewable energy consumption today.
The power sector has made significant progress in recent years, but the speed of progress
must be accelerated. In 2017 the power sector added 167 gigawatts (GW) of renewable energy
capacity globally, a robust growth of 8.3% over the previous year and a continuation of previous
growth rates since 2010 averaging 8% per year. Renewable power generation accounted for an
estimated quarter of total global power generation, a new record. New records were also set for
solar and wind installation, with additions of 94 GW in solar photovoltaic (PV) and 47 GW wind
power, including 4 GW of offshore wind power. Renewable power generation costs continue to fall.
There is ample evidence that power systems dominated by renewables can be a reality, so the scale
and speed of renewable energy deployment can be accelerated with confidence.
Industry, transport and the building sectors will need to use more renewable energy. In these
sectors, renewable sources including increased renewable electricity supply, but also solar thermal,
geothermal energy and bioenergy, must play important roles. Renewable electricity will play an
increasingly important role but a large contribution are renewable fuels and direct-uses that are
needed for heat and transport. For these the use of biomass could provide a little under two-thirds
of renewable energy used for heat and fuel; solar thermal could provide around one-quarter; and
geothermal and other renewable sources the remainder.
Energy efficiency is critical in the building sector. However, the slow rate at which energy
efficiency in the sector is improving, due in part to the low building renovation rates of just 1% per
year of existing building stock, remains a major issue. A three-fold increase in this renovation rate
is necessary. In industry, the high energy demand of certain industries, the high carbon content of
certain products, and high emission processes, require novel solutions and lifecycle thinking.
EXECUTIVE SUMMARY
10
Energy intensity improvements (%/yr) Renewables share in TFEC (%)
Transport
Contribution to
percentage
renewables share in
TFEC by sector
Industry and
Buildings
Electricity
1.3%
18%
25%
65%
1.8%
1.8%
2.8%
1.5x
0
0.5
1.0
1.5
2.0
2.5
3.0
2015-2050
REmap
Case
2015-2050
Reference
Case
2010-20152000-2010
0
10
20
30
40
50
60
70
80
2050
REmap
Case
2050
Reference
Case
2015
The global energy transformation makes economic sense. The additional costs of the
comprehensive, long-term energy transition would amount to USD (United States Dollars) 1.7
trillion annually in 2050. However, cost-savings from reduced air pollution, better health and lower
environmental damage would far outweigh these costs. The REmap Case suggests that savings
in these three areas alone would average USD 6 trillion annually by 2050. In addition, the energy
transition would significantly improve the energy system’s global socio-economic footprint
compared with business-as-usual, improving global welfare, GDP (Gross Domestic Product)
and employment. Across the world economy, GDP increases by 2050 in both the reference and
transition scenarios. The energy transition stimulates economic activity additional to the growth
that could be expected under a business as usual approach. The cumulative gain through increased
GDP from 2018 until 2050 would amount to USD 52 trillion
Substantial additional investment in low-carbon technologies will be required compared to
current and planned policies. Cumulative investment in the energy system between 2015 and 2050
will need to increase around 30%, from USD 93 trillion according to
current and planned policies, to USD 120 trillion to enable the energy
transition. Investment in renewable energy and energy efficiency
would absorb the bulk of total energy investments. Also included in
this total is USD 18 trillion that would need to be invested in power
grids and energy flexibility – a doubling over current and planned
policies. In total, throughout the period, the global economy would
need to invest around 2% of the average global GDP per year in
decarbonisation solutions, including renewable energy, energy
efficiency, and other enabling technologies.
Figure ES2. Significant improvements in energy intensity are needed and the share of
renewable energy must rise to two-thirds
Energy intensity improvement rate (%/yr) and renewable energy share in TFEC (%),
Reference and REmap cases, 2015-2050
EXECUTIVE SUMMARY
11
Energy transition
roadmap
Energy transition
roadmap
Socio-economic
system outlook
Socio-economic
system outlook
Energy-economy-
environment
model
Socio-economic
footprint
GDP
Employment
Welfare
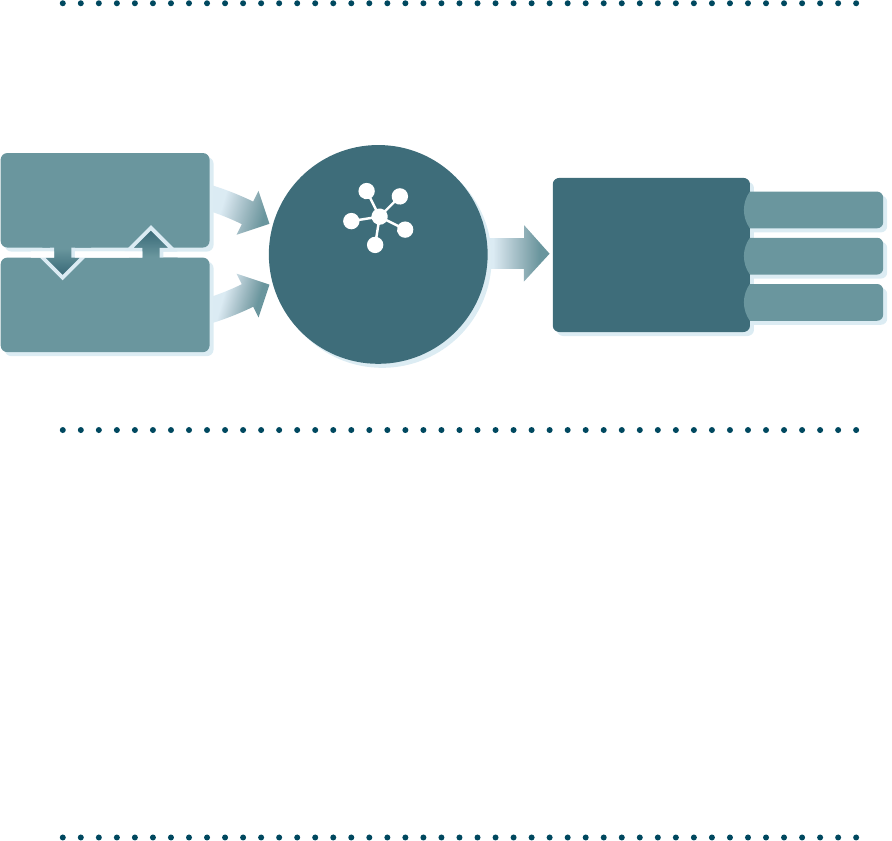
Understanding the socioeconomic footprint of the energy transition is essential to optimise
the outcome. The energy transition cannot be considered in isolation, separate from the socio-
economic system
1
in which it is deployed. Different transition pathways can be pursued, as well
as different transitions of the socio-economic system. The REmap Case significantly improves the
global socioeconomic footprint of the energy system (relative to the Reference Case). By 2050, it
generates a 15% increase in welfare, 1% in GDP, and 0.1% in employment. The GDP improvement peaks
after about a decade, while welfare continuously improves to 2050 and beyond. The socioeconomic
benefits of the transition (welfare) go well beyond GDP improvements, and include marked social
and environmental benefits. At the regional level, the outcome of the energy transition depends on
regional ambition as well as regional socioeconomic structures. Despite fluctuations in GDP and
employment, welfare will improve significantly in all regions.
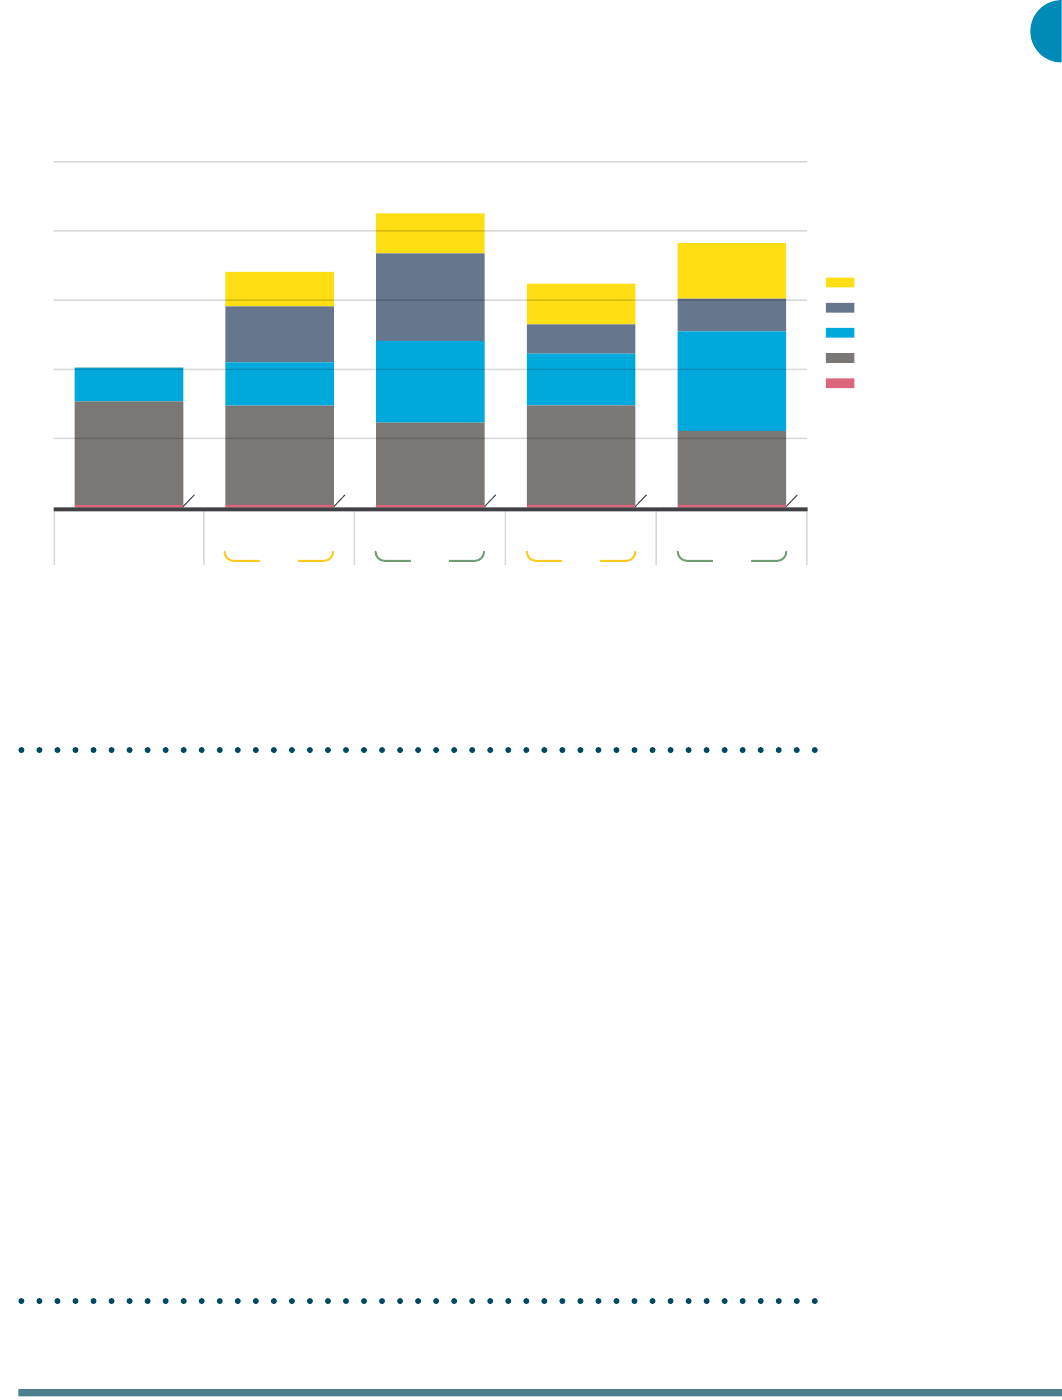
With holistic policies, the transition can greatly boost overall employment in the energy
sector. On balance, the shift to renewables would create more jobs in the energy sector than are
lost in the fossil fuel industry. The REmap Case would result in the loss of 7.4 million jobs in fossil
fuels by 2050, but 19.0 million new jobs would be created in renewable energy, energy efficiency,
and grid enhancement and energy flexibility, for a net gain of 11.6 million jobs. To meet the human
resource requirements of renewable energy and energy efficiency sectors in rapid expansion,
education and training policies would need to meet the skill needs of these sectors and maximising
local value creation. A transition that generates fair and just socioeconomic outcomes will avoid
resistances that could otherwise derail or halt it. Transforming the socioeconomic system is one of
the most important potential benefits.
EXECUTIVE SUMMARY
Figure ES3. Obtaining the socio-economic footprint from a given combination of an energy
transition roadmap and a socio-economic system structure and outlook.
1 This report often makes reference to the socio-economic conceptual construct. The socio-economic system
includes all the social and economic structures and interactions existing within a society. The energy transition
is not to be deployed as a standalone component, but within the existing socio-economic system, with many
and complex interactions taking place between them. Holistically addressing these interactions from the
onset prevents barriers and opens the door to greater and deeper transformational potential. Improvements
in both the energy transition and the socio-economic system, enhancing the synergies between them,
contributes to boosting the overall transition outcome.
12
All regions of the world stand to benefit from the energy transformation, although the
distribution of benefits varies according to socio-economic context. As expected, socio-
economic benefits are not distributed uniformly across countries and regions. This is because
the effects play out differently depending on each country’s or region’s dependence on fossil
fuels, ambition in its energy transition, and socio-economic characteristics. In terms of welfare,
the strongest overall improvements are found in Mexico, closely followed by Brazil, India and the
countries and territories of Oceania. Other regions, including rest of East Asia, Southern Africa,
Southern Europe, and Western Europe also record high welfare gains. Environmental benefits are
similar in all countries, because they are dominated by reduced greenhouse gas (GHG) emissions
given its global nature. Regional net gains in employment fluctuate over time, but the impact is
positive in almost all regions and countries.
Accelerated deployment must start now. Early action to channel investments in the right
energy technologies is critical to reduce the scale of stranded assets. The slow progress of
emission mitigation to date means that the adoption of a mitigation path detailed in this report
will result in stranded assets worth more than USD 11 trillion. If the world starts to accelerate the
energy transition today based largely on renewable energy and energy efficiency, it would limit the
unnecessary accumulation of energy assets, which would otherwise have to be stranded; minimise
Million jobs
0.7
30
9.8
0.8 0.7 0.8 0.8
28.7
12.5
16.2
10.0
23.9
23.6
25.3
11.6
28.8
14.9
8.5
11.8
21.4
28.8
9.4
16.1
Grid Enhancement**
Energy Eciency
Renewables
Fossil Fuels***
Nuclear
40.5
68.2
85.0
64.8
76.5
2030
REmap
Case
2030
Reference
Case
2050
REmap
Case
2050
Reference
Case
0
20
40
60
80
100
2016 - Estimate*
* Estimates for jobs in energy eciency and grid enhancement are not available for 2016.
** The jobs in grid enhancement (or back up power) are created in the development, operation and maintenance of infrastructure to add more flexibility to the grid
*** Includes all jobs the fossil fuel industry including in their extraction, processing and consumption
Figure ES4. The energy transition would generate over 11 million additional
energy sector jobs by 2050
Employment in the overall energy sector, 2016, 2030 and 2050 (million jobs)
* Estimates for jobs in energy efficiency and grid enhancement are not available for 2016.
** The jobs in grid enhancement make reference to the jobs for T&D grids and Energy Flexibility, created in
the development, operation and maintenance of infrastructure to enable the integration of RES into the
grid.
*** Includes all jobs the fossil fuel industry including in their extraction, processing and consumption
EXECUTIVE SUMMARY
13

the environmental and health damage caused by fossil fuel use; and reduce the need to resort in
the future to environmentally questionable technologies, such as carbon capture and storage or
nuclear power.
The financial system should be aligned with broader sustainability and energy transition
requirements. Financial constraints and inertia can inhibit the investment required to deliver the
energy transition. Increasing access to finance and lowering borrowing costs would increase both
GDP and employment further, while also enabling the transition pathway detailed in this report.
Policy measures and structural socioeconomic modifications increase the availability of finance
without compromising regional financial stability. Sources of finance that currently contribute
little to sustainable energy investment should be unlocked. Potential sources include institutional
investors (pension funds, insurance companies, endowments, sovereign wealth funds) and
community-based finance. Scarce public finances should be used to mitigate key risks and lower
the cost of capital in countries and regions where renewable energy investments are perceived to
be high risk. Rapid action is required to remove this potentially significant transition barrier and
ensure that the introduction of clean and modern energy sources is not further delayed.
Focus areas
While the energy transition described in this report is technically feasible and
economically beneficial, it will not happen by itself. Policy action is urgently
needed to steer the global energy system towards a sustainable pathway.
This report identifies six focus areas where policy and decision makers need to act:
1.
Tap into the strong synergies between energy efficiency and renewable energy. This
should be among the top priorities of energy policy design because their combined effect
can deliver the bulk of energy-related decarbonisation needs by 2050 in a cost-effective manner.
2.
Plan a power sector for which renewables provide a high share of the energy. Transforming
the global energy system will require a fundamental shift in the way energy systems are
conceived and operated. This, in turn, requires long-term energy system planning and a shift to
more holistic policy-making and more co-ordinated approaches across sectors and countries. This
is critical in the power sector, where timely infrastructure deployment and the redesign of sector
regulations are essential conditions for cost-effective integration of solar and wind generation on a
large scale. These energy sources will become the backbone of power systems by 2050.
3.
Increase use of electricity in transport, building and industry. Urban planning, building
regulations, and other plans and policies must be integrated, particularly to enable deep
and cost-effective decarbonisation of the transport and heat sectors through electrification.
However, renewable electricity is only part of the solution for these sectors. Where energy services
in transport, industry and buildings cannot be electrified, other renewable solutions will need to be
deployed, including modern bioenergy, solar thermal, and geothermal. To accelerate deployment
of these solutions, an enabling policy framework will be essential.
EXECUTIVE SUMMARY
14

EXECUTIVE SUMMARY
4.
Foster system-wide innovation. Just as the development of new technologies has played a
key role in the progress of renewable energy in the past, continued technological innovation
will be needed in the future to achieve a successful global energy transition. Efforts to innovate must
cover a technology’s full life-cycle, including demonstration, deployment and commercialisation. But
innovation is much broader than technology research and development (R&D). It should include new
approaches to operating energy systems and markets as well as new business models. Delivering
the innovations needed for the energy transition will require increased, intensive, focused and co-
ordinated action by national governments, international actors and the private sector.
5.
Align socio-economic structures and investment with the transition. An integrated
and holistic approach is needed by aligning the socio-economic system with the transition
requirements. Implementing the energy transition requires significant investments, which adds to
the investment required for adaptation to climate change already set to occur. The shorter the time
to materialize the energy transition, the lower the climate change adaptation costs and the smaller
the socio-economic disruption. The financial system should be aligned with broader sustainability
and energy transition requirements. Investment decisions made today define the energy system of
decades to come. Capital investment flows should be reallocated urgently to low-carbon solutions,
to avoid locking economies into a carbon-intensive energy system and to minimise stranded assets.
Regulatory and policy frameworks must be established quickly which give all relevant stakeholders
a clear and firm long-term guarantee that energy systems will be transformed to meet climate
goals, providing economic incentives that fully reflect the environmental and social costs of fossil
fuels and removing barriers to accelerate deployment of low carbon solutions. The increased
participation of institutional investors and community-based finance in the transition should be
facilitated and incentivized. The specificities of distributed investment needs (energy efficiency and
distributed generation) should be addressed.
6.
Ensure that transition costs and benefits are fairly distributed. The scope of the transition
required is such that it can only be achieved by a collaborative process that involves the
whole of society. To generate effective participation, the costs and benefits of the energy transition
should be shared fairly, and the transition itself should be implemented justly. Universal energy
access is a key component of a fair and just transition. Beyond energy access, huge disparities exist
at present in the energy services available in different regions. The transition process will only be
complete when energy services converge in all regions. Transition scenarios and planning should
incorporate access and convergence considerations. A social accounting framework that enables
and visualizes the transition contributions and obligations from individuals, communities, countries
and regions should be promoted and facilitated. Advances should be made in the definition and
implementation of a fair context to share the transition costs, while promoting and facilitating
structures that allow a fair distribution of the transition benefits. Just transition considerations
should be explicitly addressed from the onset, both at the micro and macro levels, creating the
structures that provide alternatives allowing those individuals and regions that have been trapped
into the fossil fuel dynamics to participate from the transition benefits.
15
The global energy system has to be transformed. An energy supply system based largely
on fossil fuels has to be based, instead, on renewable energy. This report sets out a path to
energy system decarbonisation based on high energy efficiency and renewable energy. It provides
evidence showing how the transition is occurring, and how the deployment of renewables is making
energy supply more sustainable.
This report also demonstrates that decarbonisation is both technically feasible and can be
achieved at a lower cost and with greater socio-economic benefits than business as usual.
This can create a world that is both more prosperous and exposed to fewer long-term risks.
The starting objective of the analysis is to limit the global temperature rise to below 2°C in
the present century, with 66% probability. Although energy-related CO
2
emission growth in
2014-2016 was flat, estimated emission levels increased by 1.4 % in 2017 to reach a historic high of
32.5 Gt (IEA, 2018a). Currently, the world is not nearly on course to meet the well below 2°C climate
objective, and even further from attaining the aspirational target of limiting warming to 1.5°C.
Nevertheless, the power sector registered significant progress in some areas during 2017. The
deployment of renewables reached record levels, in terms of both power generation and
capacity addition (IRENA, 2018a). Record increases were also recorded in electromobility and
other forms of electrification of end uses (such as heat pumps), while the use of modern bioenergy
and solar thermal and geothermal energy also increased. Overall the share of renewables in total
final energy consumption grew by an estimated 0.25%, to around 19% of TFEC, a new record.
Growth in renewable energy must nevertheless greatly accelerate. The world needs to increase
the share of renewable energy in TFEC from 19% in 2017 to two-thirds by 2050. In parallel, the
global economy needs to reduce energy intensity by 2.8% per year on average to 2050, compared
with the 1.8% annual fall achieved in recent years. This would bring global energy consumption in
2050 to slightly below current levels despite significant population and economic growth over the
period. Improvements in energy efficiency slowed in the last few years, causing carbon dioxide
emissions to rise in 2017. A recent report by the International Energy Agency (IEA) nevertheless
indicates progress and suggests that abundant opportunities exist to accelerate energy efficiency
worldwide (IEA, 2018b).
INTRODUCTION
INTRODUCTION
16
INTRODUCTION
This report sets out how an energy transition acceleration could be achieved. It outlines the
supply side and demand side technological changes required, and indicates the level of investment
needed. It also analyses the costs and benefits of energy transition. It concludes that the additional
cost of energy transition (about USD 1.7 trillion annually in 2050) are dwarfed by the benefits (on
average USD 6.3 trillion in the same year). If a more broad-based welfare indicator is considered,
overall benefits could be much higher. Global GDP would also grows and would be 1% larger in
2050 compared to the Reference Case, which is based on current and planned policies including
Nationally Determined Contributions (NDCs). Millions of additional jobs would be created worldwide.
In sum, a sustainable energy future is technically and economically feasible.
The global energy system must be transformed. Although addressing climate change remains
a key driver, the energy transition brings a much wider range of benefits than simply carbon
emissions reduction. It can make universal energy access affordable, improve human health,
increase energy security and diversify energy supply. A new International Renewable Energy
Agency’s (IRENA) Commission on the geopolitics of energy transition is currently mapping such
impacts (IRENA, 2018b). At the same time, the energy sector alone will not provide every solution.
A holistic approach to energy transition should be adopted that considers all facets of the economy
and society. The transition should also be just: policies should promote universal energy access and
identify and support those who will be adversely affected by changes the transition would bring.
While many approaches can reduce energy-related carbon emissions – a key driver of climate
change - there is universal agreement that energy efficiency and renewable energy are the
two main pillars. The report describes and provides guidance on how to manage the transition.
Energy systems can of course be transformed in many different ways: the report describes one,
based on IRENA’s understanding of current technology.
The majority of the technologies presented in the report are available today, and their
deployment can be accelerated immediately. This said, new technological solutions need to be
found and applied in some areas. A number of emerging technologies need to be pioneered and
supported. They include examples such as offshore wind, innovative storage solutions, electric
mobility, renewable hydrogen, and advanced biofuels for aviation. If the world starts working
towards the energy transition today, it could achieve substantial emission reductions, including
those necessary to keep the rise in average global temperate below 2°C; limit the accumulation of
energy assets that would become obsolete before the end of their technical lifetime, costing many
trillions of dollars; minimise collateral damage caused by fossil fuel use; and reduce the need to
have recourse in the future to environmentally questionable technologies such as carbon capture
and storage (CCS) in the power sector.
17

Box 1 This report and its focus
In March 2017, IRENA and the IEA issued a report, Perspectives for
the Energy Transition: Investment needs for a low-carbon energy
system (IEA and IRENA, 2017). Several subsequent reports set out
IRENA’s analysis in more detail. They included: Accelerating the
Energy Transition through Innovation (IRENA, 2017a), Stranded Assets
and Renewables (IRENA, 2017b), and Synergies between Renewable
Energy and Energy Efficiency (IRENA, 2017c). Also in recent years
IRENA has released numerous reports examining the socio-economic benefits of
renewable energy, including Renewable Energy Benefits – Measuring the Economics
and a series of reports focused on renewable energy benefits, on leveraging local
industries and capacities and an annual review of employment in the renewable
energy industry (IRENA, 2017d; 2017e; 2016).
Global policy frameworks and energy markets continue to evolve, and the situation has changed
since these analyses were released. Important market developments are also taking place.
Because the cost of renewable energy technologies continues to fall, projections of renewable
energy in country energy plans have risen. The increasing attractiveness of renewable energy
technologies also influences investment flows. This report therefore updates IRENA’s REmap
analysis of key countries and regions.
Based on the updated REmap transition pathway presented in this report, new socio-economic
analysis has also been conducted, and this report presents new findings on how the transition
would affect socio-economic footprints and key indicators such as GDP, employment and welfare.
It also touches on how to finance the transition.
The scope, complexity and detail of country discussions have evolved significantly. Where
discussions once focused primarily on renewable energy deployment, they now consider how
high shares of variable renewable energy (VRE) can be incorporated in power grids, the role of
electrification, solutions for decarbonising heating and transport demand, and more integrated
long-term planning of energy systems. This illustrates how dynamic and broad the challenges
are and the opportunities that the energy transition raises. Recognising this, the report proposes
not just an energy pathway for the energy transition, but focus areas to help policy makers
understand and plan for the energy transition.
The results indicate why we need an energy transition, what it might look like, who will be
affected, and, last but not least, how much it will cost. To better examine these implications, this
report focuses its analysis on two possible pathways for the global energy system:
Reference Case. This scenario takes into account the current and planned policies
of countries. It includes commitments made in NDCs and other planned targets. It presents a
“business-as-usual” perspective, based on governments’ current projections and energy plans.
REmap Case. This analyses the deployment of low-carbon technologies, largely
based on renewable energy and energy efficiency, to generate a transformation of the global
energy system which for the purpose of this report has the goal of limiting the rise in global
temperature to below 2°C above pre-industrial levels by the end of the century (with a 66%
probability).
For more information about the REmap approach and methodology, please visit:
http://www.irena.org/remap/methodology
INTRODUCTION
18

STATUS OF THE ENERGY TRANSITION
The energy transition is underpinned by the rapid decline of renewable energy costs. Additions
to renewable power capacity are exceeding fossil fuel generation additions by a widening margin.
In 2017 the sector added 167 GW of renewable energy capacity globally, a robust growth of 8.3%
over the previous year and a continuation of previous growth rates since 2010 averaging 8-9%
per year. For the sixth successive year, the net additional power generation capacity of renewable
sources exceeded that of conventional sources. In 2017, 94 GW were added by solar PV and 47 GW
by wind power (including 4 GW of offshore wind) (IRENA, 2018a). Renewable power generation
accounted for an estimated quarter of total global power generation in 2017, a record.
At the same time, costs, including the costs of solar PV and wind, continue to fall. Lower costs
open the prospect of electricity supplies dominated by renewables, but also herald a shift to clean
renewable energy for all kinds of uses. The decline in costs of some new emerging technologies
are also surprising. In 2017, offshore wind projects were offered at market prices without requiring
subsidy for the first time, and concentrated solar power including thermal storage was being
offered at less than 10 US cents per kilowatt-hour (kWh) (IRENA, 2018c).
Auction results and continued technical innovations suggest that costs will fall further in the
future. Solar PV costs are expected to halve again by 2020 (relative to 2015-2016). Between
early 2017 and early 2018, global weighted average costs for onshore wind and solar PV stood
at USD 6 cents and USD 10 cents per kWh, respectively (IRENA, 2018c). Recent auction results
suggest that some future projects will significantly undercut these averages.
The integration of renewable power in power systems also broke records in 2017. Remarkably,
solar and wind power provided over half of the power produced in the eastern region of
Germany. In that region, the utility 50Hertz has demonstrated the economic and technical
feasibility of running power systems reliably with a high share of variable renewables (50Hertz,
n.d.). Many jurisdictions around the world deployed higher levels of renewable power than they
ever had before, for days, weeks or months. There is ample evidence by now that power systems
dominated by renewables can work and be an important asset, underpinning economic growth.
These recent trends show clearly that growth in renewable power is accelerating. At the same
time, current growth rates are insufficient to achieve the level of decarbonisation required by 2050.
Significant additional electrification of heating, transport and other energy services will be required,
and growth in renewable power must continue to accelerate to make this possible.
Outside the power sector, progress is lagging. Electricity accounts for 20% of the total final
energy consumption for transport, heat and other energy services (broadly defined as the end-use
sectors of building, industry and transport). Around 80% is obtained from other sources, notably
fossil fuels and direct use of renewable thermal energy or fuels. In the end-use sectors, energy
efficiency is critical, but renewable sources such as solar thermal and geothermal energy, and
bioenergy, can play an important role. Furthermore, increasing the share of electricity, and the
share of renewables in electricity supply, will raise the share of renewables in end-use sectors.
STATUS OF THE
ENERGY TRANSITION:
A MIXED PICTURE
19
STATUS OF THE ENERGY TRANSITION
Electrification opens up the prospect of decarbonised road transport. In 2017, an estimated
1.2 million new electric vehicles were sold globally (around 1.5% of all car sales), a record level
(Spiegel, 2018). China passed the United States to become the largest market. Sales of electric
vehicles have grown rapidly in the last five years at a compound annual growth rate of 52%.
Over one billion electric vehicles could be on the road by 2050 if the world starts soon on
the path to decarbonisation detailed in this report.
The building sector consumes proportionately more electricity than other end-use sectors.
Fossil fuels are mainly used for heating and cooking. Electrification for cooking and modern
cookstoves are important alternatives for hundreds of millions of people who cook using traditional
biomass. In terms of heating, heat-pump deployment achieved a new record in 2017. Building codes
are aiming for near-zero or even energy positive buildings in the near future, for example in Japan.
However, the slow rate at which the energy efficiency in the sector is improving, due in part to
the low building renovation rates of just 1% per year of the existing stock, remains a major issue. A
three-fold increase in the renovation rate is necessary.
The most challenging sector is industry. The high energy demands of certain energy
intensive industries, the high carbon content of certain products, and the high emissions of
certain processes make innovative solutions and lifecycle thinking necessary. Heavy industry
as a whole has advanced far in increasing its use of renewables in 2017 or in the immediately
preceding years; but electrification and the development of innovative technological solutions
for biochemical and renewable hydrogen feedstock (for example, for primary steel making)
continue apace.
20
0
300
600
900
1 200
1 500
20502045204020352030202520202015
Reference Case: 2.6°C – 3.0°C
Cumulative CO by 2050: 1 230 Gt
Annual CO in 2050: 34.8 Gt/yr
50% 1.5°C
Energy sector CO budget:
2015 - 2100: 300-450 Gt
Net annual CO
emissions
in 2050: 0 Gt/yr
REmap Case: 66% <2°C
Cumulative CO by 2050: 760 Gt
Annual CO in 2050: 9.7 Gt/yr
Energy-related CO budget
66% <2°C 2015-2100: 790 Gt
2037:
CO budget
exceeded
Reductions in REmap Case
compared to Reference Case
Cumulative by 2050: -470 Gt
Annual in 2050: -25.1 Gt/yr
Cumulative energy-related carbon emissions (Gt CO)
ENERGY-RELATED CO
2
EMISSIONS
ENERGY-RELATED
CARBON DIOXIDE EMISSIONS:
BRIDGING THE GAP
The reduction of energy-related CO
2
emissions is at the heart of the energy transition. Many
governments have strengthened efforts to reduce national emissions in the last year. The Reference
Case indicates the projected fall in cumulative energy-related CO
2
emissions as a result of these
revised policies and plans, including NDCs. Projected energy-related CO
2
emission in the Reference
Case between 2015 and 2050 have declined from 1 380 Gt to 1 230 Gt, an 11% drop compared to
the previous year analysis. However, this improvement is not yet reflected in current CO
2
emissions
which grew by around 1.4% in 2017 (IEA, 2018a).
Government plans also still fall short of emission reduction needs. The Reference Case
indicates that, under current and planned policies, the world will exhaust its energy-related
CO
2
emission budget in under 20 years. To limit the global temperature increase to below 2°C
(with a 66% probability), cumulative emissions must be reduced by a further 470 Gt by 2050
(compared to current and planned policies as shown in Figure 1).
Figure 1. In under 20 years, the global energy-related CO
2
emissions budget to keep warming
below 2°C would be exhausted
Cumulative energy-related CO
2
emissions and emissions gap, 2015-2050 (Gt CO
2
)
Based on current policies (set out in the Reference Case), in under 20 years,
cumulative energy-related emissions will exceed the carbon budget required
to hold temperature increases below 2°C. Emission reductions of 470 Gt
will be needed by 2050 to reduce warming to 2°C.
21
35
30
25
20
15
10
5
0
2015 20202010 2025 2030 2035 2040 2045 2050
Reference Case: 35 Gt/yr in 2050
Renewable
energy:
41%
Energy
eciency:
40%
Electrification
w/RE:
13%
REmap Case: 9.7 Gt/yr in 2050
94% CO
emission
reductions from
Renewables and
Energy Eciency
Others:
6%
Energy-related CO emissions (Gt/yr)
Buildings
Transport
District Heat
Power
Industry
Buildings
Transport
District Heat
Power
Industry
ENERGY-RELATED CO
2
EMISSIONS
According to the Reference Case (which reflects current and planned policies including NDCs),
energy-related CO
2
emissions will increase slightly year on year to 2040, before dipping
slightly by 2050 to remain roughly at today’s level (Figure 2). This is an improvement relative to
the 2017 analysis, which found annual CO
2
emissions were higher in 2050, and shows that NDCs and
the rapidly improving cost and performance of renewable energies are having an effect on long-
term energy planning and scenarios (IRENA, 2017f). However, significant additional reductions are
needed. To meet a climate target of limiting warming 2°C, annual energy-related CO
2
emissions
still need to decline by 2050 from 35 Gt (in the Reference Case) to 9.7 Gt, a fall of more than 70%.
IRENA’s analysis concludes that renewable energy and energy efficiency, coupled with deep
electrification of end-uses, can provide over 90% of the reduction in energy-related CO
2
emissions that is required. The remainder would be achieved by fossil fuel switching (to natural
gas) and carbon capture and sequestration in industry for some of industrial process emissions.
Nuclear power generation would remain at 2016 levels. Simultaneously, a significant effort is
required to reduce carbon emissions generated by industrial processes and land use to less than
zero by 2050. The climate goal cannot be reached without progress also in those areas.
Additionally, if the climate objective was raised to restrict global temperature rise to 1.5°C, the
aspirational goal of the Paris Agreement, this would require significant additional emission
reductions and a steeper decline in the global emission curve. Energy-related CO
2
emissions of
about zero would be necessary by around 2040 if emissions did not become net-negative at any
point, or would need to fall to zero by 2050 if negative emission technologies were employed in the
second half of the century.
Figure 2. Renewable energy and energy eciency can provide over 90% of the reduction in
energy-related CO
2
emissions
Annual energy-related CO
2
emissions and reductions, 2015-2050 (Gt/yr)
Annual energy-related emissions are expected to remain flat (under
current policies in the Reference Case) but must be reduced by over 70%
to bring temperature rise to below the 2°C goal. Renewable energy and
energy efficiency measures provide over 90% of the reduction required.
22
0
100
200
300
400
500
600
700
800
205020502015
Total primary energy supply (EJ/yr)
85%
15%
73%
27%
34%
66%
Non-renewable
Renewable
REmap CaseReference Case
TPES increases
40% by 2050
under current
and planned
policies
Accelerated deployment
of renewables and
energy eciency result
in 30% decline in
TPES
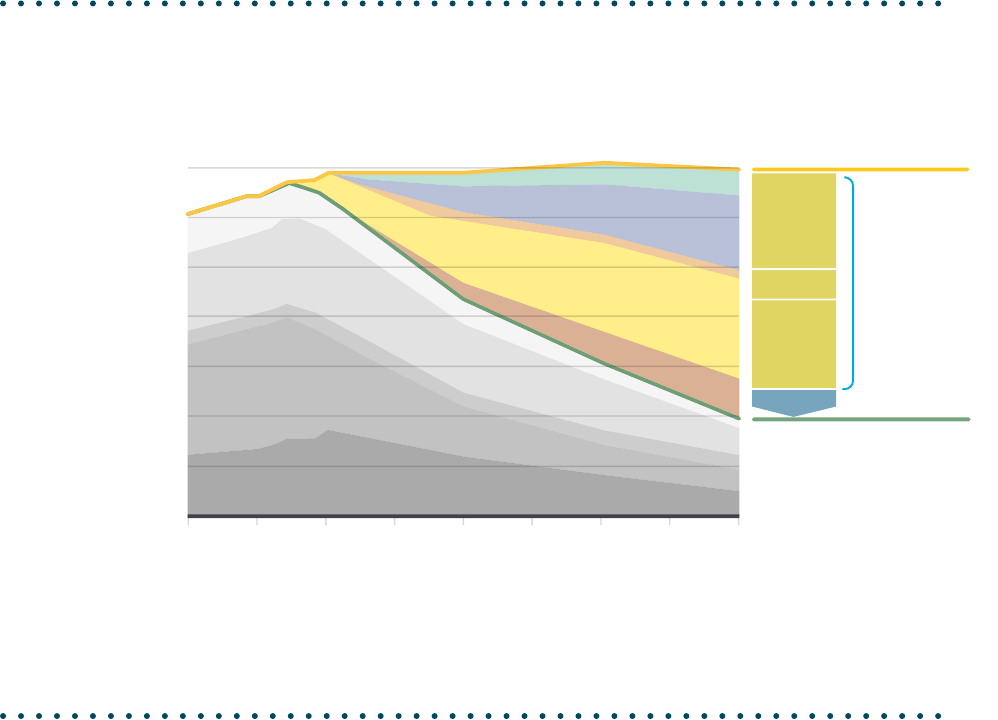
A PATHWAY FOR TRANSFORMATION
A PATHWAY FOR
THE TRANSFORMATION
OF THE GLOBAL ENERGY SYSTEM
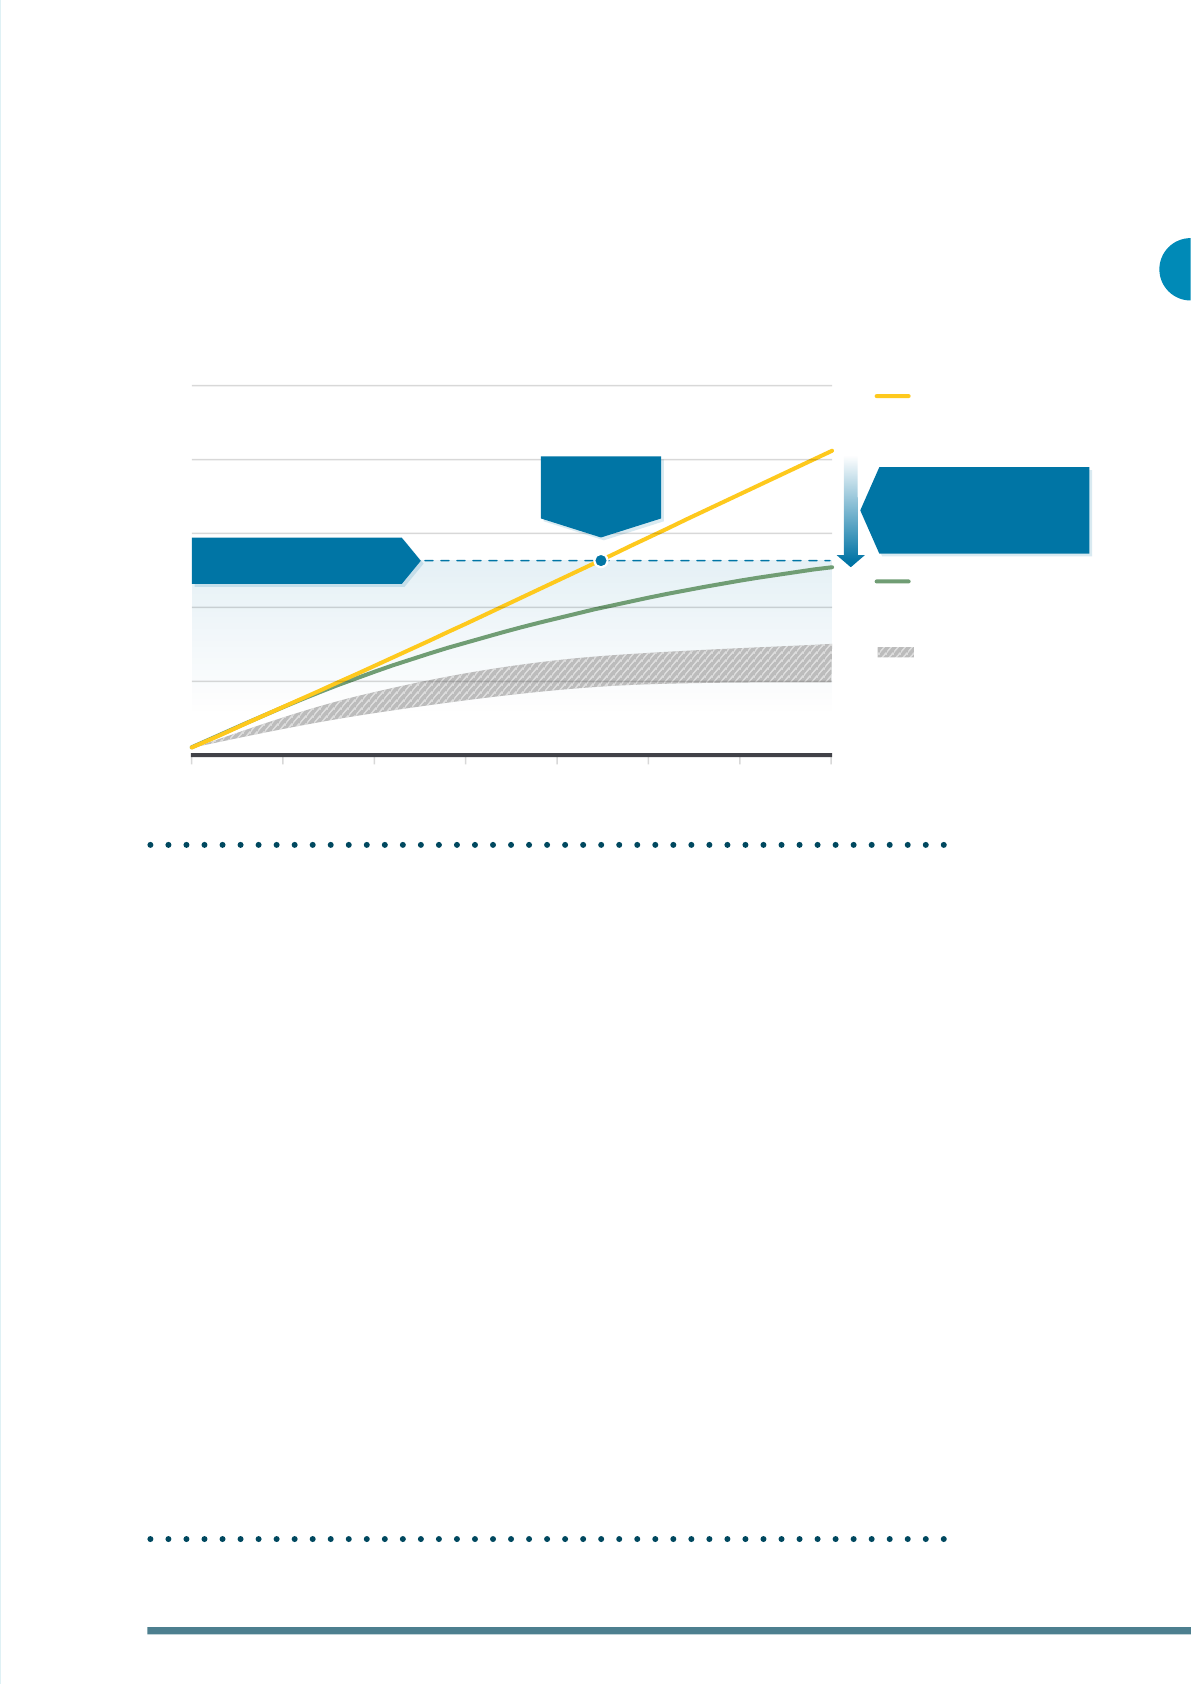
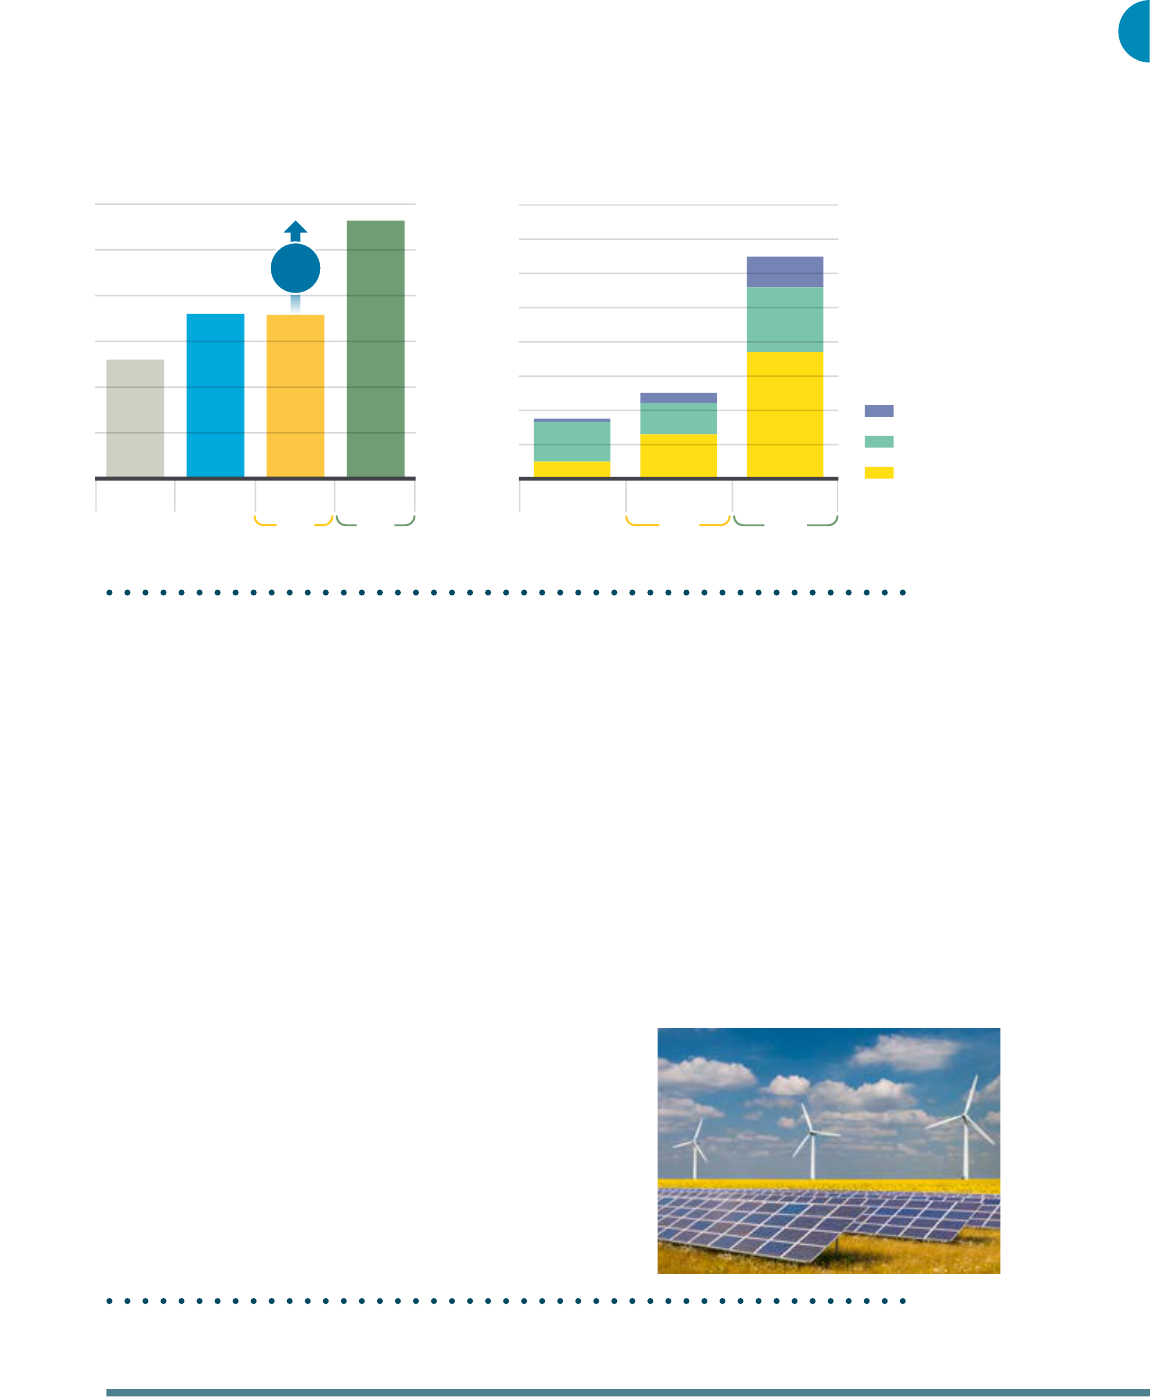
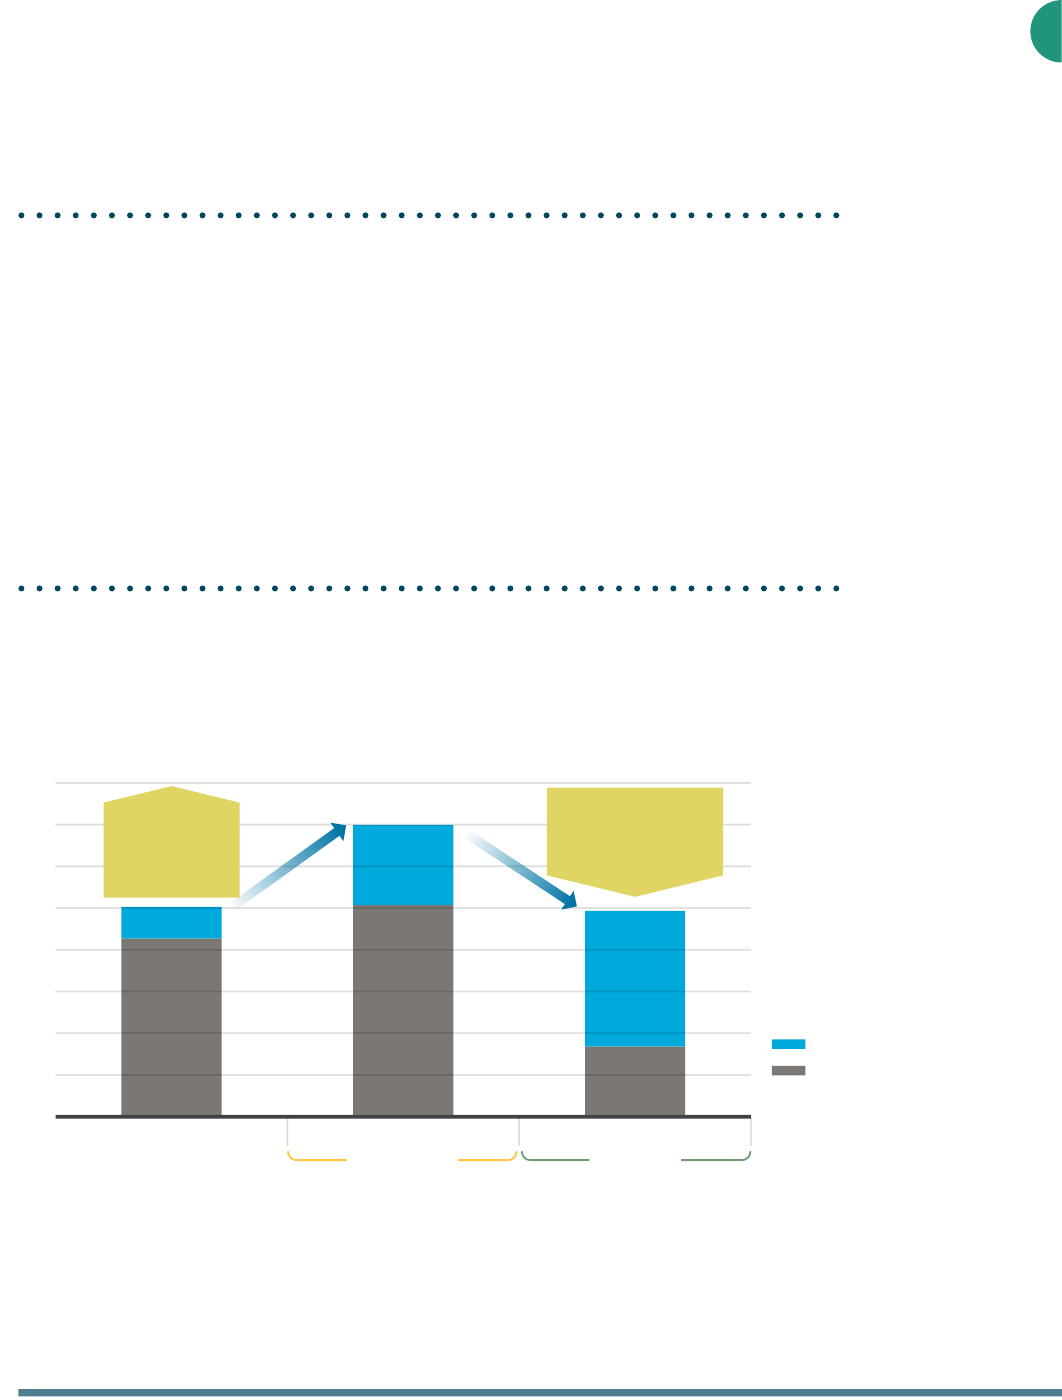
The total share of renewable energy must rise from around 15% of TPES in 2015 to around
66% in 2050 (Figure 3). Under current and planned policies, the Reference Case suggests, this
share increases only to 27%. Under the REmap Case, renewable energy use would nearly quadruple
from 64 exajoule (EJ) in 2015 to 222 EJ in 2050. The renewable energy mix would change, from
one dominated by bioenergy to one in which over half of renewable energy would be solar and
wind-based. Bioenergy would continue to account for about one-third of renewable consumption
by 2050.
Remarkably, because it leverages the vast synergies between renewable energy and energy
efficiency, under the REmap Case TPES would fall slightly below 2015 levels, despite significant
population and economic growth. To make the substantial energy efficiency improvements
required, the global economy needs to reduce energy intensity by 2.8% per year on average to
2050, compared with the 1.8% annual fall achieved in recent years.
Under current and planned policies (the Reference Case) TPES is expected to
increase almost 40% by 2050. To achieve a pathway to energy transition (the
REmap Case), energy efficiency would need to reduce TPES slightly below 2015
levels, and renewable energy would need to provide two-thirds of the energy supply.
Figure 3. The global share of renewable energy would need to increase to two-thirds and TPES
would need to remain flat over the period to 2050
TPES and the share of renewable and non-renewable energy under the Reference and
REmap cases, 2015-2050 (EJ/yr)
23
Notes: Data in
clude energy supply in electricity generation, district heating/cooling, industry, buildings and transport sectors. These sectors accounted for 85%
of global total primary energy supply in 2015. Non-energy use of fuels for the production of chemicals and polymers is excluded from the values in the figure.
0
50 000
100 000
150 000
200 000
250 000
300 000
350 000
400 000
20502040203020152010
0
20 000
40 000
60 000
80 000
100 000
2050 2050204020302015
2015
2010
0
6 000
9 000
3 000
12 000
15 000
18 000
Total final energy consumption (PJ/yr) Electricity generation (TWh/yr) Renewables installed power capacity (GW)
REmap Case REmap Case REmap Case
Others (incl. marine and hybrid)
Coal
Oil
Gas
Geothermal
Wind
CSP
Solar PV
Bioenergy
Hydro
Nuclear
Coal
Oil
Gas
Traditional biomass
Modern biomass
Other renewables*
*includes solar thermal, geothermal heat and hydrogen
District heat
Electricity
A PATHWAY FOR TRANSFORMATION
The acceleration envisaged in the REmap Case would significantly transform the global
energy system. The power sector would be underpinned by the wide-scale deployment of
renewable energy and increasingly flexible power systems, supporting cost-effective integration.
The share of renewable energy in the power sector would increase from 25% in 2017 to 85% in
2050. This transformation would require new approaches to power system planning, system and
market operations, and regulation and public policy. Renewable electricity would account for
just under 60% of total renewable energy use in final energy terms, two and a half times today’s
share.
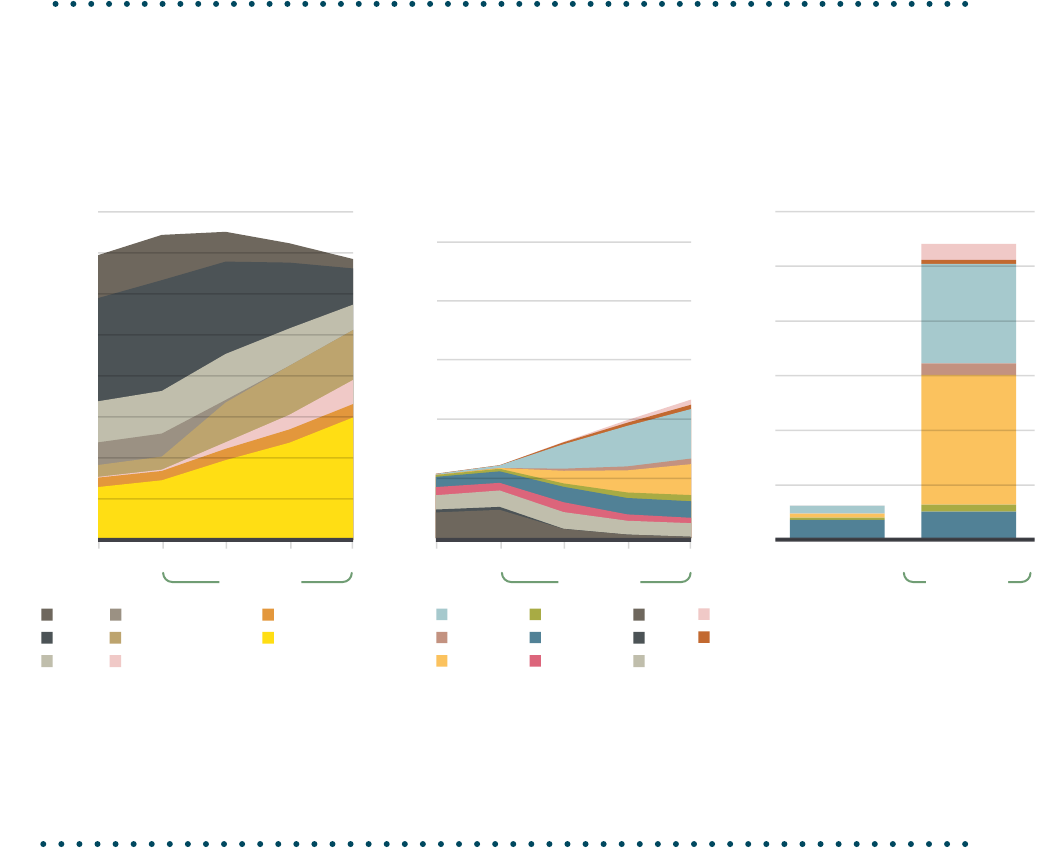
As low-carbon electricity becomes the preferred energy carrier, the share of electricity
consumed in end-use sectors would need to increase from approximately 20% in 2015 to 40%
in 2050 (Figure 4). For example, electric vehicles and heat pumps would become much more
common in most parts of the world. While renewable power would account for just under 60% of
renewable energy consumption, direct use of renewable energy would be responsible for a sizeable
proportion of energy use in industry, buildings and transport. Two-thirds of this would involve
direct use of biomass; around one-quarter would be generated by solar thermal and the remainder
by geothermal and other renewable sources.
Figure 4. The rising importance of electricity derived from renewable energy
Share of electricity in total final energy consumption (PJ/yr), electricity generation mix
(TWh/yr), and renewable capacity developments (GW), REmap Case, 2015-2050
The share of electricity in total final energy consumption needs to double between
2015 and 2050.
24
Energy intensity improvements (%/yr) Renewables share in TFEC (%)
Transport
Contribution to
percentage
renewables share in
TFEC by sector
Industry and
Buildings
Electricity
1.3%
18%
25%
65%
1.8%
1.8%
2.8%
1.5x
0
0.5
1.0
1.5
2.0
2.5
3.0
2015-2050
REmap
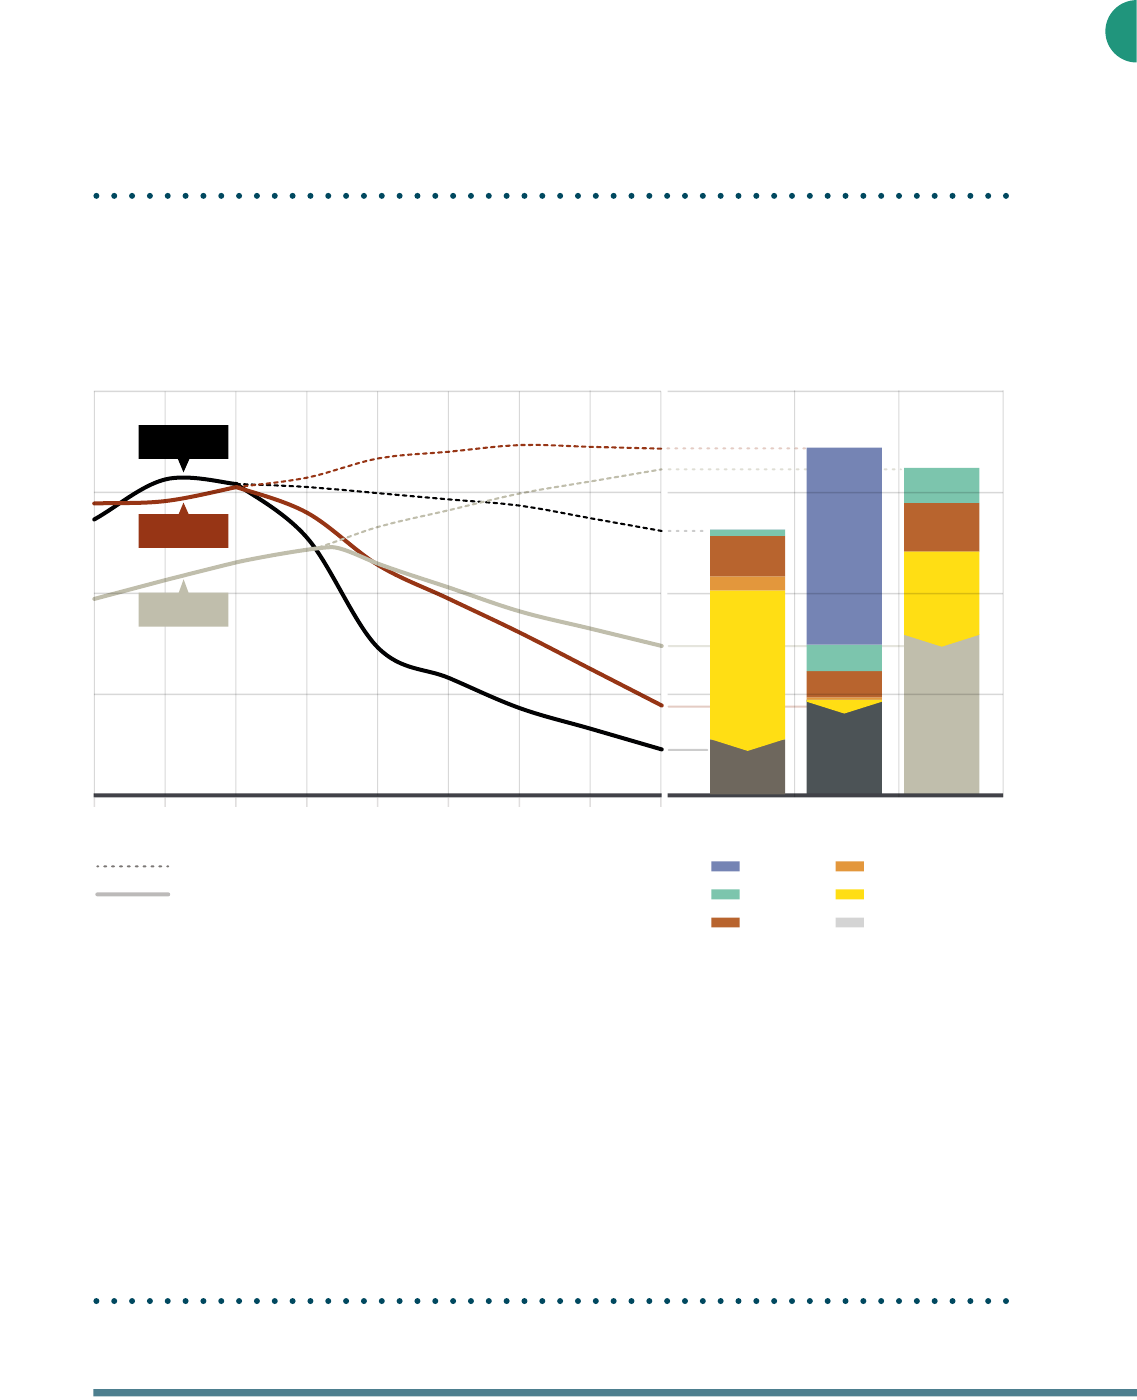
Case
2015-2050
Reference
Case
2010-20152000-2010
0
10
20
30
40
50
60
70
80
2050
REmap
Case
2050
Reference
Case
2015
A PATHWAY FOR TRANSFORMATION
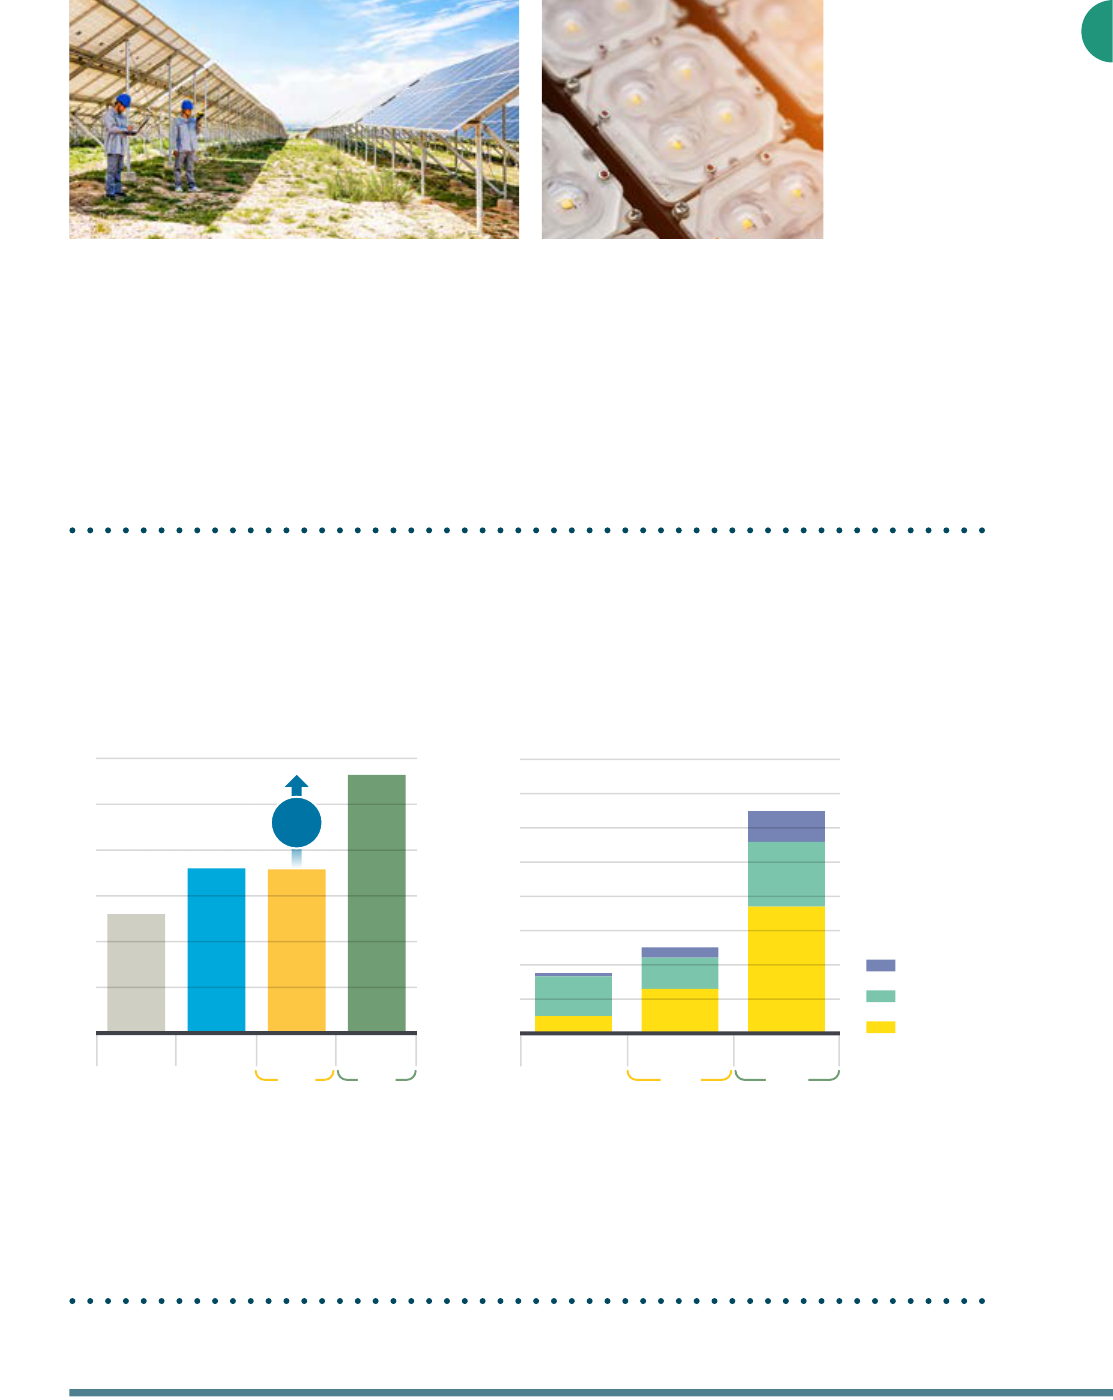
The energy intensity of the global economy would need to fall by about two-thirds by 2050.
In recent years, energy intensity has been falling at around 1.8% per year (Figure 5). The rate of fall
would need to increase one-and-a-half times, to 2.8% per year. The share of renewable energy in
TFEC would have to increase from 18% in 2015 to 65% in 2050. In recent years, the annual increase
in the percentage share of renewable energy has been around 0.2 percentage point per year, and
estimates suggest it increased by 0.25 percentage points in 2017. A six to seven-fold increase is
therefore needed (from 0.2-0.25 percentage point per year to 1.4 percentage point per year) to
raise the share from 18% to 19.4% in the first year and then incrementally, to reach 65% in 2050.
Figure 5. Significant improvements in energy intensity are needed and the share of renewable
energy must rise
Energy intensity improvement rate (%/yr) and renewable energy share in TFEC (%),
Reference and REmap cases, 2015-2050
Both renewable energy and energy efficiency are at the heart of the
energy transition and climate goals. By 2050 action in both areas must be
scaled up considerably.
Source: Historical energy intensity improvement values from (SE4ALL, 2016), projections based on IRENA analysis
25
Hydrogen
Liquid biofuels/biogas
District heat: Renewables
District heat: Non-Renewables
Electricity: Non-Renewables
Electricity: Renewables
Traditional biomass
Modern biomass
Geothermal heat
Solar thermal
REmap
Case
Reference
Case
0
10 000
20 000
30 000
40 000
50 000
60 000
70 000
80 000
90 000
100 000
2015 2050 2050 2050 2050 2050 2050
0
50 000
100 000
150 000
200 000
250 000
300 000
350 000
0
50 000
100 000
150 000
200 000
250 000
300 000
350 000
2015
2015
REmap
Case
Reference
Case
REmap
Case
Reference
Case
Electricity consumption (TWh) Industry and buildings
final energy consumption (PJ/yr)
Transport final energy consumption (PJ/yr)
Non-Renewables
Non-Renewables
Others (incl. marine and hybrid)
Geothermal
Bioenergy
Hydro power
Wind
Solar PV (incl. CSP)
A PATHWAY FOR TRANSFORMATION
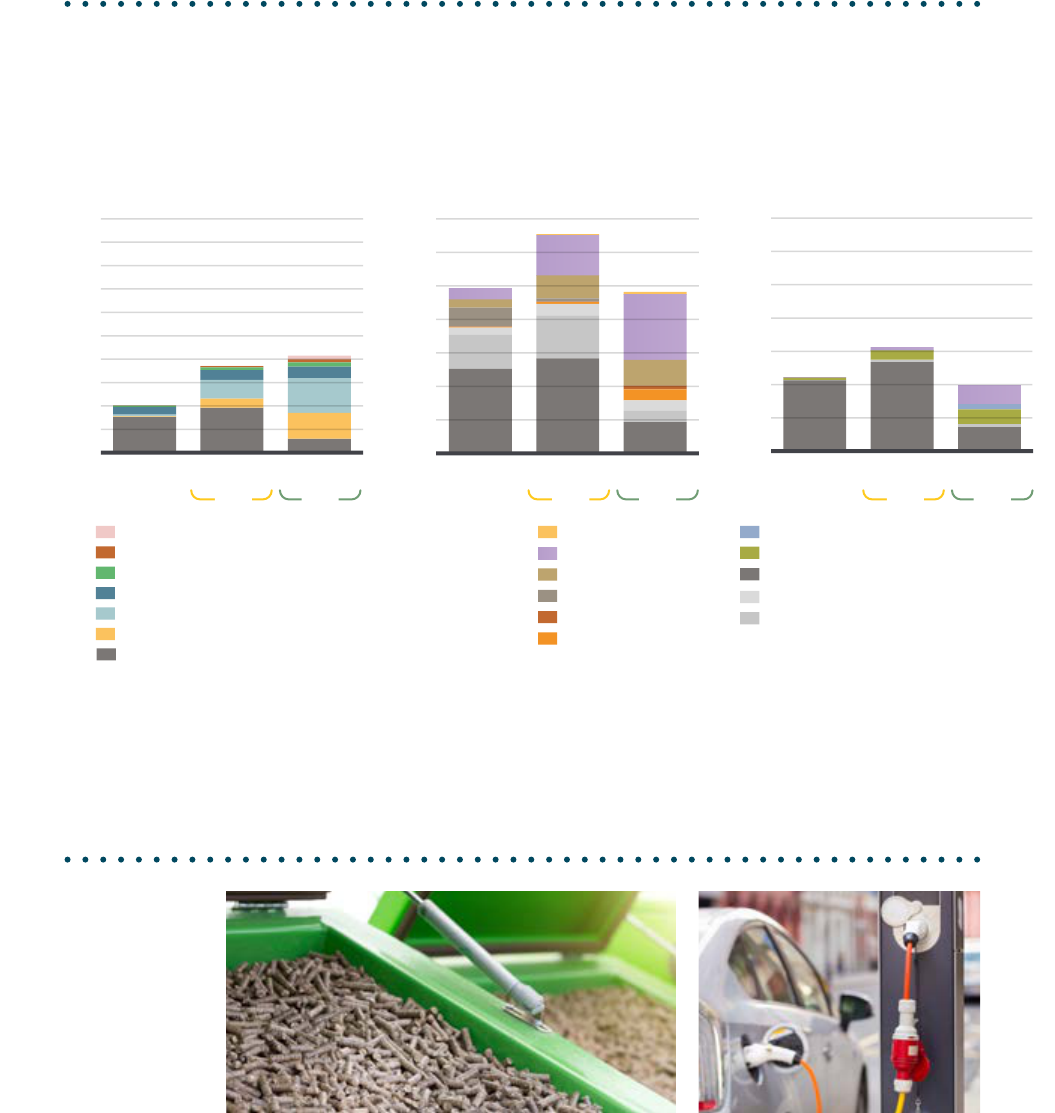
Modern bioenergy can play a vital role in the energy transition if scaled up significantly.
Although more modern bioenergy has been used in recent years, its growth is insufficient to
support the requirements of the energy transition. A much stronger and concerted effort is needed,
particularly in sectors (shipping, aviation and various industrial applications) for which bioenergy
could provide key solutions. Bioenergy will have to be sourced from sustainable and affordable
feedstocks.
Figure 6. Renewable energy should be scaled up to meet power, heat and transport needs
Use of renewable and fossil energy in electricity generation, buildings and industry, and
transport - Reference and REmap cases, 2015-2050 (TWh/yr or PJ/yr)
The share of electricity rises to 40% of TFEC in the REmap Case, and 85% of
electricity generation is from renewable sources.
Note. Since 3.6 PJ equals 1 TWh, the axis for electricity consumption on the left is scaled to match the values of the other two
figures, making comparison possible.
26
205020452040203520302025202020152010
0
50
100
150
200
0
50
100
150
200
Energy-related fossil fuel demand (EJ) Demand decline in 2050 (EJ)
Coal
Oil
Natural Gas
Power
District heat
Industry
Buildings
TransportReference Case
REmap Case
Remaining in 2050
GasOil
-128 EJ
-88 EJ
Coal
-108 EJ
A PATHWAY FOR TRANSFORMATION
By 2050 in the REmap Case, fossil fuel use for energy would fall to one-third of today’s
levels. Oil and coal would decline most, 70% and 85% respectively. Natural gas use would peak
around 2027, and would be the largest source of fossil fuel by 2050, however with production
declining 30% from the present level.
Figure 7. The declining importance of fossil fuels
Fossil fuel use (left, EJ/yr), 2015-2050; decline in fossil fuel use by sector - REmap Case relative to Reference Case
Under the REmap Case, both oil and coal demand decline significantly and
continuously, and natural gas demand peaks around 2027. In 2050, natural gas
is the largest source of fossil fuel.
Note: Figure includes only fossil fuel use for energy and excludes non-energy use.
27

COUNTRY AMBITION FOR THE ENERGY TRANSITION
COUNTRY AMBITION
FOR THE ENERGY
TRANSITION
The renewable energy mix will change considerably over the coming decades. The mix
today includes significant use of traditional bioenergy; in the future, the mix will increasingly be
dominated by renewable electricity, advanced biofuels, and electrification technologies (largely
utilising renewable power), including electric vehicles and heat-pumps. The largest renewable
energy markets approximately match the areas of greatest energy demand (China, the USA, India
and the EU) but Brazil, Indonesia, Japan and Canada are also important markets. The Group of
Twenty (G20) countries made up 60% of global renewable energy consumption in 2015 but will be
responsible for almost 85% in 2050 in the REmap Case.
In 2015, the share of renewables in country energy systems ranged from just above zero to over
50%. According to current and planned policies (the Reference Case), most countries foresee
modest increases in renewable energy while some even forecast a decline in the share of
renewable energy by 2050. In India and Indonesia, this is explained by falls in traditional bioenergy
use following the adoption of more efficient cooking stoves that use bioenergy or other fuels such
as liquefied petroleum gas or kerosene. China is an interesting case: the share of renewables grows
by far more than in any other G20 country (both in percentage and absolute terms); most of this
growth occurs between 2030 and 2050.
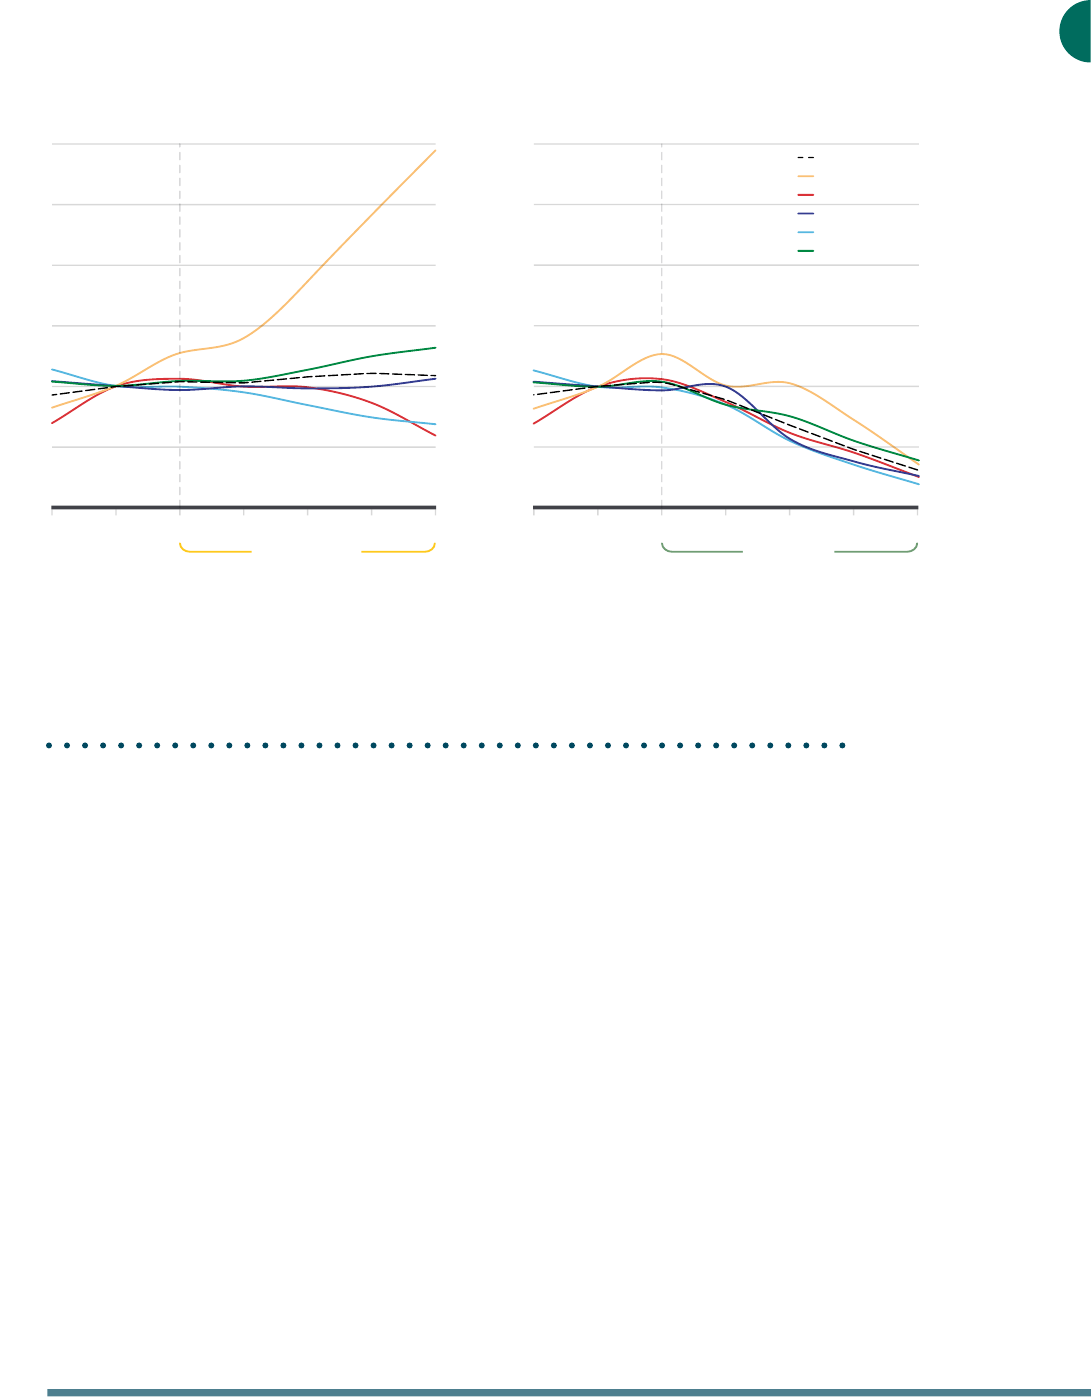
The report’s analysis shows that all countries can substantially increase renewable energy as
a proportion of total energy by 2050. The REmap Case shows that every country has a different
potential to add renewable energy but the potential is substantial in all cases. In countries such
as Canada, India and the United States of America, projections raise the share of renewables in
total final energy use to above 60%. With a few exceptions, such as the Russian Federation and
Saudi Arabia, the share of renewables in all countries exceeds 40%, and many exceed 60%. The
highest shares are projected in countries such as Brazil, France and Germany. When the increase
in renewable share is combined with higher energy efficiency, the effect is a significant drop in
energy-related CO
2
emissions (Figure 8).
.
Along with renewable energy, energy efficiency is a key driver of reduced energy-related CO
2
emissions in the energy transition. At country level, the energy intensity of GDP would fall by
between 50% and 75%. Such a fall is required across all energy consuming economies. The
largest declines are required in India and China, where falls in energy intensity would bring energy
intensity levels to just 20% or 25% of 2015 levels by 2050. Energy intensity levels in the EU and USA
must also drop steeply to about half today’s levels.
28
20502040203020202017f20152010
0%
50%
100%
150%
200%
250%
300%
0%
50%
100%
150%
200%
250%
300%
20502040203020202017f20152010
rest of the World
USA
India
EU
China
Global
Reference Case CO emissions Index (2015 = 100%) REmap Case CO emissions Index (2015 = 100%)
Reference Case
REmap Case
COUNTRY AMBITION FOR THE ENERGY TRANSITION
Action at country level is key to driving the energy transition forward. Many countries are
advancing towards the energy transition, but despite positive steps, no country is yet on a pathway
that will achieve the energy transition’s goals:
• China is the world’s largest energy producer, consumer, and power generator. At the same time, it
ranks top in terms of installed hydropower, and wind and solar PV power generation capacity, and
is the largest user of solar water heaters and geothermal heat. In 2015, renewables provided 7% of
China’s total final energy use. Under the REmap Case, this share increases to 67% by 2050.
• The European Union has been at the forefront of global renewable energy deployment and has
played a key role in raising international awareness and advancing policy action to address the
global challenge of climate change. The region has nearly doubled its share of renewable energy
from 2005 to 2015 to reach almost 17%. However, more effort will be needed to meet long-term
decarbonisation commitments and the region would need to increase this share to 70% by 2050.
• India is advancing towards its target to achieve 175 GW of renewable power capacity by 2022. In
2015, renewables accounted for 36% of India’s final energy use, one of the highest shares in the G20
countries. However, if traditional use of bioenergy is excluded, its share of modern renewables is
around 10%. Under the REmap Case, India would increase the share of modern renewables to 73%
by 2050.
• The United States of America continues to introduce renewables at a strong pace despite some
headwinds. Renewables currently account for just 8% of total final energy use; the country needs
to increase that share to 63% under the REmap Case.
Under the REmap Case, emissions in countries fall to between 20%
and 40% of 2015 levels by 2050.
Figure 8. A rapid and significant decline in energy-related CO
2
emissions is necessary in all countries
Energy-related CO
2
projections in selected countries - Reference and REmap Cases,
2010-2050 (% change compared to 2015)
Source: Historic emission values from (IEA, 2015), projections based on IRENA analysis
29

Share of renewable
energy in primary
energy supply
Share of renewable
energy in final
energy use
CHINA EU INDIA USA
Electricity use in
final energy
consumption
Share of renewable
energy in power
Decarbonisation
investments between
2015 and 2050*
(USD trillion)
GDP impact**
Employment
impact**
REmap
Case
Reference
Case
REmap
Case
Reference
Case
REmap
Case
Reference
Case
REmap
Case
Reference
Case
20502030 20502030 20502030 20502030
20502015 20502015 20502015 20502015
19%
54%
22%
41%
18%
48%
20%
51%
5%
69%
13%
74%
9%
75%
9%
63%
7%
67%
17%
70%
10%
73%
8%
63%
26%
94%
29%
94%
15%
92%
14%
78%
15
22.4
5.4
8.6
6.4
10.2
6
14.1
3.7
%
1.4%
N/A
N/A
0.9%
-0.4%
1.6%
1.8%
0.2%
0.3%
N/A
N/A
0.5%
0.2%
0.2% 0.4%
COUNTRY AMBITION FOR THE ENERGY TRANSITION
Table 1. Key indicators relevant to the energy transition in selected countries (REmap Case)
Note: Shares of renewable energy in final energy use refer to modern renewable energy
* Investments include investments in renewable energy (for power and end-uses), in energy efficiency and
infrastructure, and in energy flexibility to integrate renewables in the power sector.
** The figures show the difference in GDP and employment between the REmap Case and the Reference Case.
30
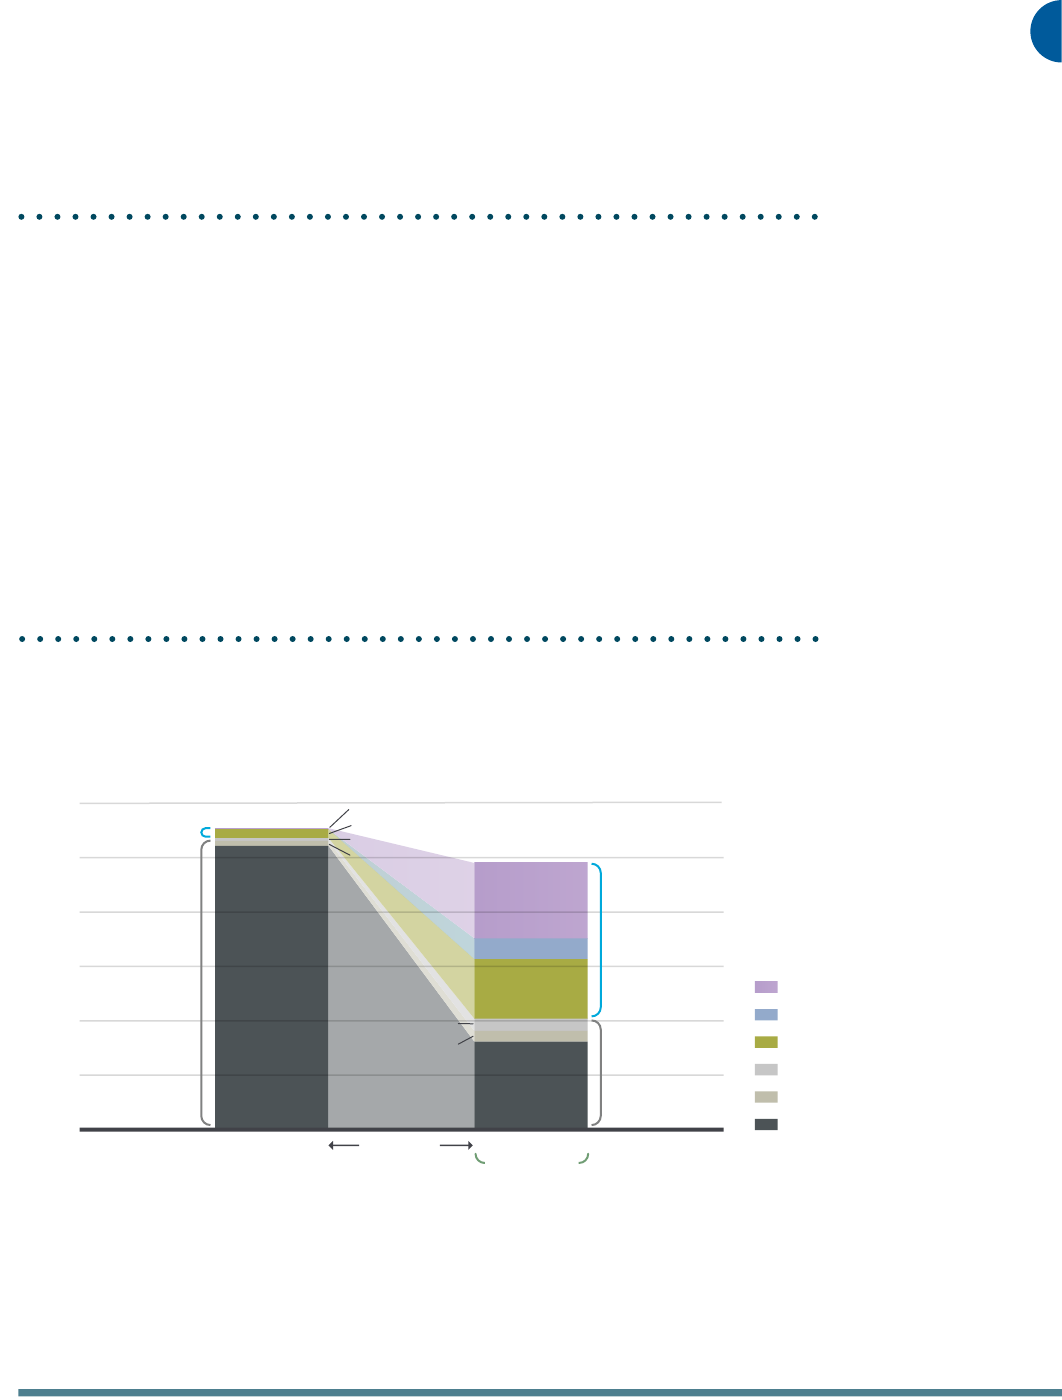
0
20 000
40 000
60 000
80 000
100 000
120 000
20502015
Transport final energy consumption (PJ)
Electricity: Renewables
Hydrogen
Liquid biofuels and biogas
Electricity: Non-Renewables
Gas
Oil
REmap Case
2015-2050
changes
RenewablesRenewables
Non-RenewablesNon-Renewables
58%
42%
RenewablesRenewables
<1%
3%
1%
2%
94%
28%
22%
8%
5%
4%
33%
Non-RenewablesNon-Renewables
4%
96%
ANALYSIS AND INSIGHTS IN KEY SECTORS
ANALYSIS
AND INSIGHTS
IN KEY SECTORS
TRANSPORT
The transport sector lags behind in the energy transition. Globally, the share of renewable energy in
this sector is very small at just 4% in 2015 (Figure 6). Use of renewables is dominated by biofuels, mostly
bioethanol and biodiesel, in certain countries. Electrification, one of the technologies that can help to
decarbonise the sector if associated with renewable power generation, is also extremely limited: it has
a share of just above 1%. Shipping and aviation have also made comparatively little progress.
Analysis shows that the combination of low-carbon technologies proposed in the REmap Case can
cut transport emissions to just 3 Gt of CO
2
annually by 2050, which represents a 70% reduction
compared to current policies in the Reference Case. On its own, the transport sector would be
responsible for 30% of emission cuts (compared to the Reference Case).
KEY SECTORS: TRANSPORT
Figure 9. Transforming energy demand in the transport sector
A breakdown of final energy consumption in the transport sector, by source (PJ/yr)
The transport sector is dominated by fossil fuels and needs to undergo
a profound transformation.
31
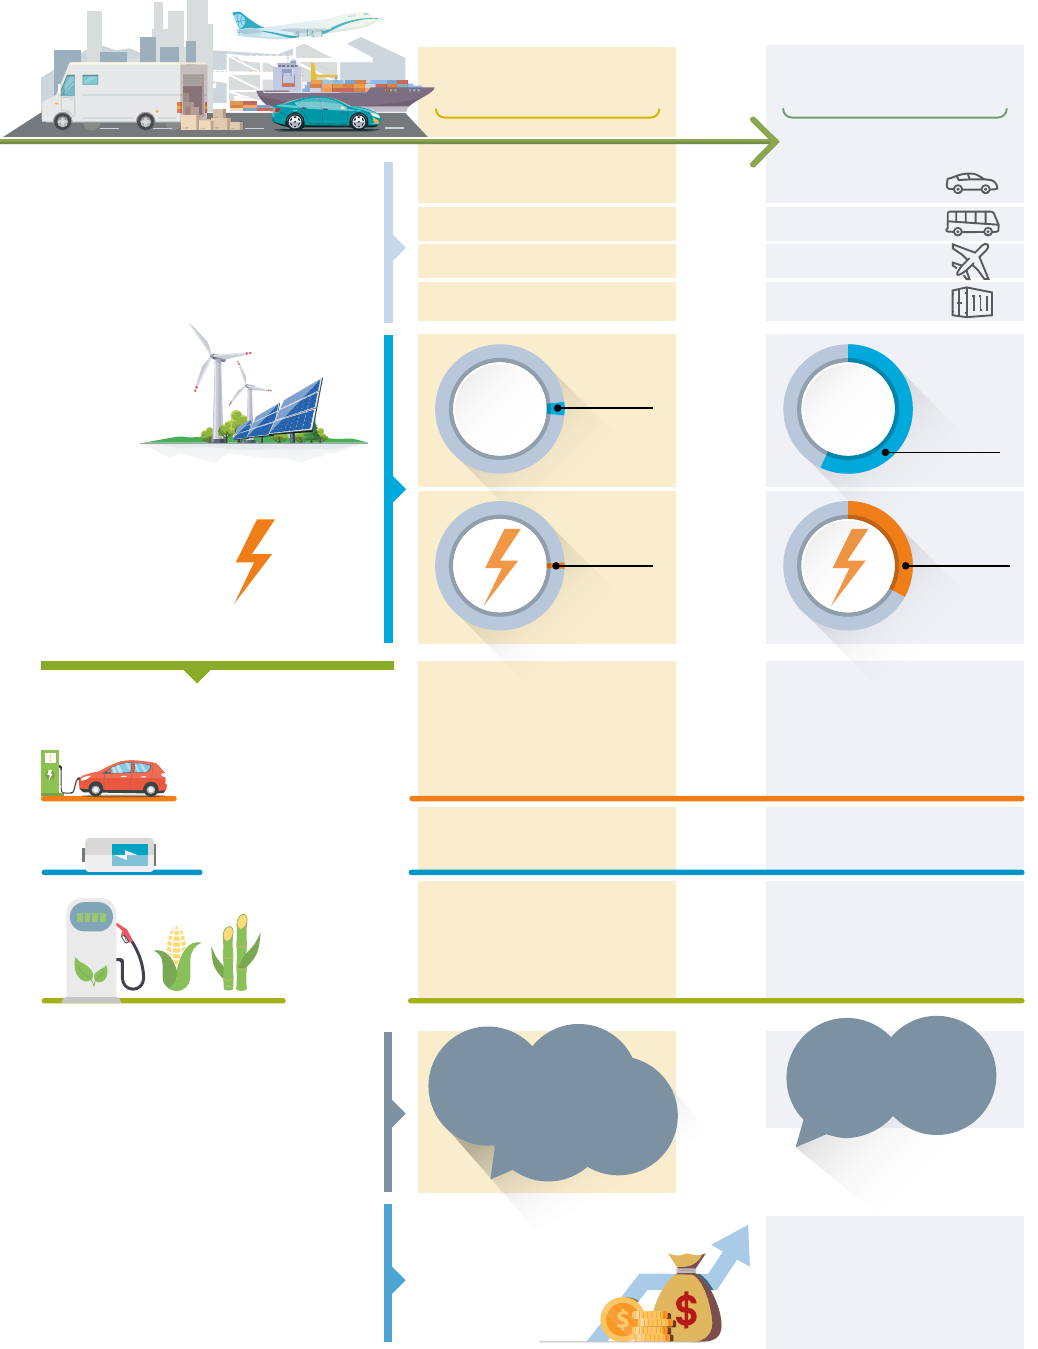
ENERGY INDICATORS
22 921
16 945
6 643
92 481
billion
passenger-
km/yr
billion
passenger-
km/yr
billion
passenger-
km/yr
billion
tonne-km/yr
billion
passenger-
km/yr
billion
passenger-
km/yr
billion
passenger-
km/yr
billion
tonne-km/yr
RENEWABLE ENERGY
AND ELECTRIFICATION SHARES
ACTIVITY
Indicators for energy use in
the Transport sector
4% 58%
Total investments for
decarbonisation between
2015 and 2050
Renewable
share in
energy use
in transport
Renewable
share in
energy use
in transport
1% 33%
Electricity
share in final
energy use
in transport
Electricity
share in final
energy use
in transport
BATTERY STORAGE
BIOFUELS
Passenger
cars
Buses,
2/3 wheelers,
rail
Aviation
Freight
Passenger
vehicles
Buses and light
duty vehicles
2/3 wheelers
Storage
Liquid
biofuels
Other
biofuels
Biomethane
available to grid from EVs
*
* Considering 50% grid
connected EVs and 25% grid
connected 2/3 wheelers
43 076
27 493
21 666
216 500
billion
liters
billion
liters
billion m
3
billion m
3
129
0.4
902
23
million
vehicles
million
vehicles
million
vehicles
GWh
GWh
million
vehicles
million
vehicles
million
vehicles
1.24
0.02
200
965
57
2 160
0.5 12 380
USD trillion
14.2
INVESTMENT
ELECTRIC MOBILITY
ENERGY RELATED
CO
2
EMISSIONS
Avoided CO
2
emissions
in 2050 compared
to Reference Case:
Gt CO
2
/yr
7.6
7.7 Gt CO
2
/yr
3.1Gt CO
2
/yr
TRANSPORT
REmap Case 20502015
ANALYSIS AND INSIGHTS IN KEY SECTORS
Figure 10. Infographic Transport
32

ANALYSIS AND INSIGHTS IN KEY SECTORS
KEY SECTORS: TRANSPORT / BUILDINGS
Under the REmap Case, the transport sector increases the electrification of passenger transport
significantly as well as the use of biofuels. The REmap Case also assumes the introduction of
hydrogen produced from renewable electricity as a transport fuel. The combination leads to a drop
of nearly 70% in oil consumption by 2050 compared to 2015. The share of electricity in all of transport
sector energy rises from just above 1% in 2015 to 33% in 2050, 85% of which is renewable. Biofuels
increase their share from just below 3% to 22% in the same period.
Under the REmap Case, in absolute terms, total liquid biofuel production grows from 129
billion litres in 2015 to just over 900 billion litres in 2050. Nearly half of this total would be
conventional biofuels, whose production would more than triple, requiring significant upscaling. The
other half would be advanced biofuels, which can be produced from a wider variety of feedstocks
than conventional biofuels, but which supply just 1% of biofuels today. The steep increase in biofuel
production requires careful planning that fully considers the sustainability of biomass supply.
New energy sources, in combination with information and communication technologies (ICT),
are changing the entire transport industry. As performance improves and battery costs fall, sales
of electric vehicles, electric buses and electric two- and three-wheelers are growing. In 2017 around
3 million electric vehicles were on the road. Under the REmap Case, the number would increase
to over 1 billion by 2050. To achieve this, most of the passenger vehicles sold from about 2040
would need to be electric. Under the REmap Case, while about half the stock of passenger vehicles
would be electric by 2050, closer to 75% of passenger car activity (passenger-kilometres) would
be provided by electric vehicles.
Another option that the REmap Case explores is the use of hydrogen as a transport fuel which
can used for example, in vehicles powered by fuel cells. This option is particularly relevant
because variable renewable electricity generation is expanding and the production of hydrogen
from renewable power may provide an important option in efforts to meet demand flexibly and
expand renewable power generation. Although the technology is not yet ready for widespread
commercialisation, some countries believe hydrogen is a potential transport fuel.
Nearly USD 14 trillion of total investment would be required under the REmap Case in the
transport sector by 2050. Around USD 3.4 trillion would be needed to develop the biofuel
(predominantly advanced biofuels) and hydrogen industries. The balance would be needed to
develop electrification and energy efficiency.
BUILDINGS
The building sector currently covers a residential and commercial floor area of 150 billion square
metres (m
2
), but this is projected to increase to 270 billion m
2
by 2050. Buildings make a significant
contribution to global emissions and need to play a central role in efforts to reduce them. Although
this is widely recognised, the sector has so far done little to promote the energy transition. In 2015,
globally, an estimated 36% (including traditional biomass) of the energy used in buildings was
renewable (Figure 12).
Electricity demand in the building sector is projected to increase by 70% by 2050, despite
improvements in appliance efficiency, because of strong growth in electricity demand (particularly
in emerging economies) and increases in the electrification of heating (using heat-pumps and
seasonal storage).
The REmap Case considers deployment of highly efficient appliances, including smart home systems
with advanced controls for lighting and heating, improved heating and cooling systems, better
insulation, replacement of gas boilers by heat pumps and other efficient boilers, and retrofitting
33
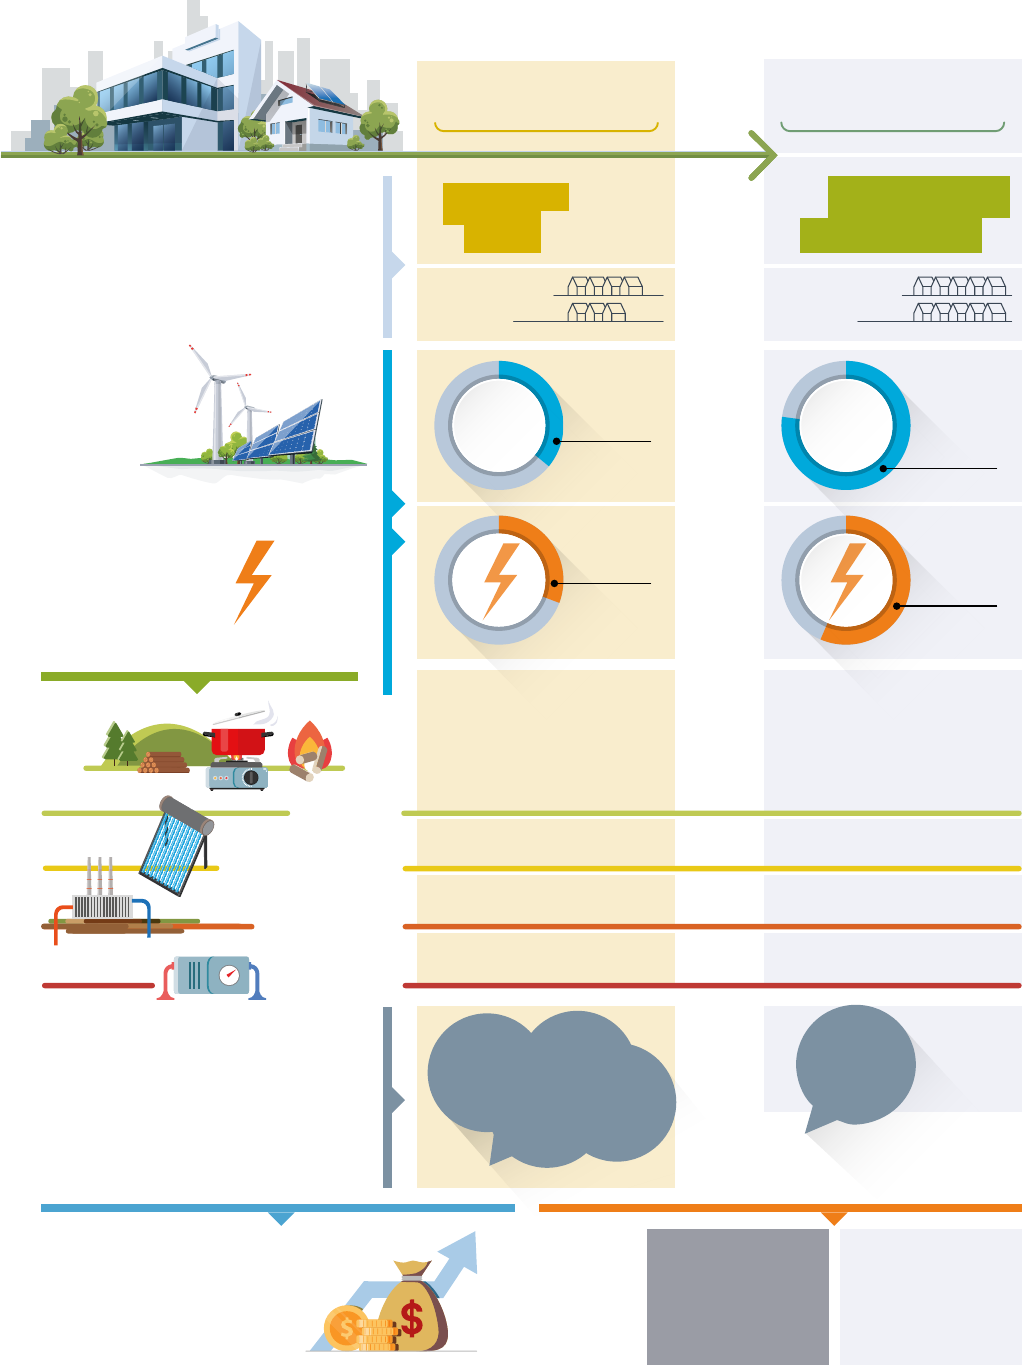
144
2.2
36% 77%
BIOMASS
million
m
2
269
million
m
2
Total
building
stock floor
area
Collector
area
Heat
Heat Pumps
Renewable
share in
energy use
in buildings
Renewable
share in
energy use
in buildings
31% 56%
Number of
households
3.2
billion
billion
Electricity
share in final
energy use
in buildings
Electricity
share in final
energy use
in buildings
SOLAR THERMAL
RENEWABLE ENERGY
AND ELECTRIFICATION SHARES
ENERGY RELATED
CO
2
EMISSIONS
ACTIVITY
HEAT PUMPS
Traditional
cookstoves
Modern
cookstoves
Heat
Avoided CO
2
emissions
in 2050 compared
to Reference Case:
622
568
48
4
6 299
0.30 1.76
20
253
GEOTHERMAL
million
units
0
867
7.6
million
units
million
m
2
million
units
EJ/yr
EJ/yr
million
m
2
million
units
EJ/yr
million
units
EJ/yr
Indicators for energy use in
the Buildings sector
2.8 Gt CO
2
/yr
Gt CO
2
/yr
2.3
Gt CO
2
/yr
0.8
Total investments
for decarbonisation
for the period
2015-2050
USD trillion
39.6
INVESTMENT
for the period
2015-2050
6.6
USD trillion
STRANDED
ASSETS
REmap Case 2050
10.8
USD trillion
Delayed Policy Action
RENEWABLE ENERGY INDICATORS
BUILDINGS
REmap Case 20502015
ANALYSIS AND INSIGHTS IN KEY SECTORS
Figure 11. Infographic Buildings
34

ANALYSIS AND INSIGHTS IN KEY SECTORS
KEY SECTORS: BUILDINGS
of old and new buildings to make them energy efficient. Under the REmap Case, these measures
would require a cumulative investment of USD 38 trillion between by 2050. In addition,
USD 1.6 trillion would be required for renewables deployment in buildings.
A significant increase in the share of modern renewables (excluding traditional uses of biomass)
for heat and other direct-use must take place. The largest increase is in solar thermal systems,
which would increase total collector area ten-fold, from around 600 million m
2
to over 6 000 million m
2
.
Heat pumps are also poised to play a critical role. Their use to heat buildings can be significantly
expanded. Heat pumps achieve energy efficiencies three to five times higher than boilers and
can be powered by renewable electricity. Under the REmap Case, the number of heat-pump units
in operation would increase from around 20 million today to over 250 million units in 2050. They
would supply 27% of the heat demand in the building sector. Efficient and clean district energy
systems would provide 16% of building heat demand, more than double today’s level.
The shift in cooking technologies from fuel to electricity will also promote renewables, due
to the high share of renewable power in electricity supply. Electric stoves, such as induction
cookstoves, can cut the energy demand of cooking by three to five times. In addition, more
renewable-based stoves that use modern biofuels and solar energy could be deployed.
New as well as renovated buildings can be made more energy efficient and rely largely on
renewable technology to supply their remaining energy demand. The majority of efficiency
investments (72% under the REmap Case) will be spent on making buildings more energy efficient.
Early action is required to avoid stranded assets and meet future re-investment needs.
Bioenergy will remain the largest renewable fuel source in buildings. It will meet about 30%
of heating and cooking demand. This implies a three-fold increase relative to today’s levels. Use of
biogas will also increase.
0
20 000
40 000
60 000
80 000
100 000
120 000
20502015
Buildings final energy consumption (PJ)
District heat: Non-renewables
District heat: Renewables
Electricity: Non-Renewables
Electricity: Renewables
Geothermal heat
Solar thermal
Modern biomass
Traditional biomass
Gas
Oil
Coal
REmap Case
2015-2050
changes
RenewablesRenewables
Non-RenewablesNon-Renewables
77%
23%
RenewablesRenewables
Non-RenewablesNon-Renewables
36%
64%
21%
23%
24%
7%
11%
7.3%
8%
5.3%
14%
10%
48%
<1%
4%
1%
5%
2%
3%
2%
4%
Figure 12. The increasing use of electricity in buildings and the decline of fossil fuels
Breakdown of final energy consumption in the building sector, by source (PJ/yr)
Modern renewable energy in the building sector needs to
increase significantly. Up to three-quarters of energy consumption
in buildings could be supplied by renewables. Electricity will
supply almost 56% of the sector’s energy demand.
35

0
30 000
60 000
90 000
120 000
150 000
20502015
Industry final energy consumption (PJ)
District heat: Non-renewables
District heat: Renewables
Electricity: Non-renewables
Electricity: Renewables
Geothermal heat
Solar thermal
Biomass
Gas
Oil
Coal
REmap Case
2015-2050
changes
RenewablesRenewables
Non-RenewablesNon-Renewables
63%
37%
31%
11%
20%
20%
7%
7%
15%
19%
36%
<1%
4%
2%
2%
4%
5%
6%
5%
6%
RenewablesRenewables
Non-RenewablesNon-Renewables
14%
86%
ANALYSIS AND INSIGHTS IN KEY SECTORS
INDUSTRY
To date, the industry sector has been the biggest laggard with respect to the energy
transition. In 2015 renewables provided only around 7% of industry’s direct energy use
(i.e., excluding electricity) (Figure 13). Most of this was bioenergy. Electricity supplied almost 27%
of the energy consumed by the sector.
In terms of emissions, the industrial sector is the second-largest emitter of energy-related CO
2
.
It is responsible for a third of emissions worldwide. Despite the fact that IRENA’s REmap Case
reduces the sector’s emissions by more than half by 2050 (compared to existing national plans),
industry would still emit 5.1 Gt of CO
2
in 2050 (a little under half of which would be process related
emissions). Under the REmap Case, industry becomes the largest source of emissions; its share
rises from 29% to 46% of annual emissions by 2050. Within the sector, chemical, petrochemical and
steel are among the largest emitters, because they employ energy intensive and high temperature
processes that are difficult to decarbonise.
To achieve the level of decarbonisation proposed under the REmap analysis, investment in low-
carbon energy technologies in industry would have to more than double. An additional USD 2.8
trillion (compared to the Reference Case) would be required for total investments during the period
to 2050 amounting to USD 5 trillion.
By 2050 renewable energy use in industry needs to grow by more
than four times. Biomass and renewable electrification will have
a prominent role.
Figure 13. A diverse energy mix with sizeable bioenergy demand
Breakdown of final energy consumption in the industry sector, by source (PJ/yr)
36

ANALYSIS AND INSIGHTS IN KEY SECTORS
KEY SECTORS: INDUSTRY
BIOMASS
SOLAR THERMAL
ENERGY RELATED
CO
2
EMISSIONS*
HEAT PUMPS
Avoided CO
2
emissions
in 2050 compared
to Reference Case:
GEOTHERMAL
EJ/yr
million
units
million
units
EJ/yr
EJ/yr
EJ/yr
GWth
million m
2
GWth
million m
2
EJ/yr EJ/yr
Gt CO
2
/yr
6.7
RENEWABLE ENERGY INDICATORS
14% 63%
INDUSTRY
Renewable
share in
energy use
in industry
Renewable
share in
energy use
in industry
27% 42%
Electricity
share in final
energy use
in industry
Electricity
share in final
energy use
in industry
Biomass
heat
Biomass
feedstocks
Iron
and steel
Cement
Chemical
and petro-
chemical
Aluminium
Pulp
and paper
2 872
7 237
612
167
688
Mt/yr
Mt/yr
Mt/yr
Mt/yr
Mt/yr
Mt/yr
Mt/yr
Mt/yr
Mt/yr
Mt/yr
8
0.8
20.2
10.5
3 608
8 889
1 079
269
822
0.02
4.11
0.2
80
0.23
USD trillion
REmap Case 2050
0.75
USD trillion
Delayed Policy Action
Indicators for energy use in
the Industry sector
Concentrated
solar thermal
Collector
area
0.1
1
134
3 450
RENEWABLE ENERGY
AND ELECTRIFICATION SHARES
ACTIVITY
Heat
Heat Pumps
9.5 Gt CO
2
/yr
5.1Gt CO
2
/yr
Total investments
for decarbonisation
for the period
2015-2050
* Includes process emissions
USD trillion
5.0
INVESTMENT
for the period
2015-2050
STRANDED
ASSETS
REmap Case 20502015
Figure 14. Infographic Industry
Figure 13. A diverse energy mix with sizeable bioenergy demand
Breakdown of final energy consumption in the industry sector, by source (PJ/yr)
37

ANALYSIS AND INSIGHTS IN KEY SECTORS
POWER
To deliver the energy transition at the pace and scale needed will require the almost complete
decarbonisation of the electricity sector by 2050. This can be achieved by using renewables,
increasing energy efficiency, and making power systems more flexible.
Under the REmap Case, electricity consumption in end-use sectors would double by 2050
(relative to 2015 levels) to over 42 000 TWh, while the carbon intensity of the power sector
would decline by 85% (Figure 15). By 2050 the share of renewable energy in generation would
be 85%, up from an estimated 25% in 2017. Solar and wind capacity will lead the way, rising from
800 GW today to 13 000 GW by 2050. In addition, the output of geothermal, bioenergy and
hydropower would increase by 800 GW over the period. Annual additions of installed renewable
power capacity would double to around 400 GW per year, 80% of which will be variable generation
technologies such as solar and wind. Decentralised renewable power generation grows from just
2% of total generation today to 21% by 2050, a ten-fold increase. No new coal plants should be
commissioned and 95% of coal plants in operation today should be phased out.
Investment in new renewable power capacity should increase to almost USD 500 billion per
year over the period to 2050. To create a power system with 85% renewable power will require
investments in infrastructure and energy flexibility of another USD 500 billion per year, or around
Under the REmap Case, industry must increase the share of renewable energy in direct-uses
and fuels to 48% by 2050. If renewable electricity is included the share would increase to around
two-thirds. Bioenergy sources will be the highest contributor, largely based on residues used
for direct heat and combined heat and power (CHP). In percentage terms, the largest increases
will be in solar thermal heat for low-temperature processes and also heat-pumps for similar low-
temperature heat needs. Under the energy transition, electricity should meet 41% of industry’s
energy needs by 2050.
In percentage terms, the largest growth will be in use of solar thermal heat for low-temperature
processes. Under the REmap Case, industry’s use of solar thermal heat will rise steeply to reach
3.4 billion m
2
of solar thermal collectors (concentrated and flat plate), providing 7% of industry’s
heat demand. By 2050 80 million units heat pumps will also be installed to meet similar low-
temperature heat needs (more than 80 times the number in use today).
For medium and high temperature processes, bioenergy will remain critical. Its use will increase
the most in absolute terms. Bioenergy will be drawn from biomass residues, industry waste, and
feedstocks for petrochemicals. To realise the potential of biomass, industry will need to scale up the
use and collection of residues, and develop efficient supply chains for their sale and distribution.
Hydrogen will also play an important role in the sector; the use of hydrogen derived from
renewables grows to 7 EJ by 2050. In industry, it will principally be used to replace natural gas
and produce chemicals.
There is a large potential to improve efficiency in the industrial sector. Global industrial
energy consumption could be reduced by about a quarter if the best available technologies
were adopted. Most of the improvements can be made in developing countries and economies in
transition. In particular, the sector can: improve process efficiency, adopt demand side management
solutions, introduce highly efficient motors, develop material recycling, and strengthen waste
management.
38
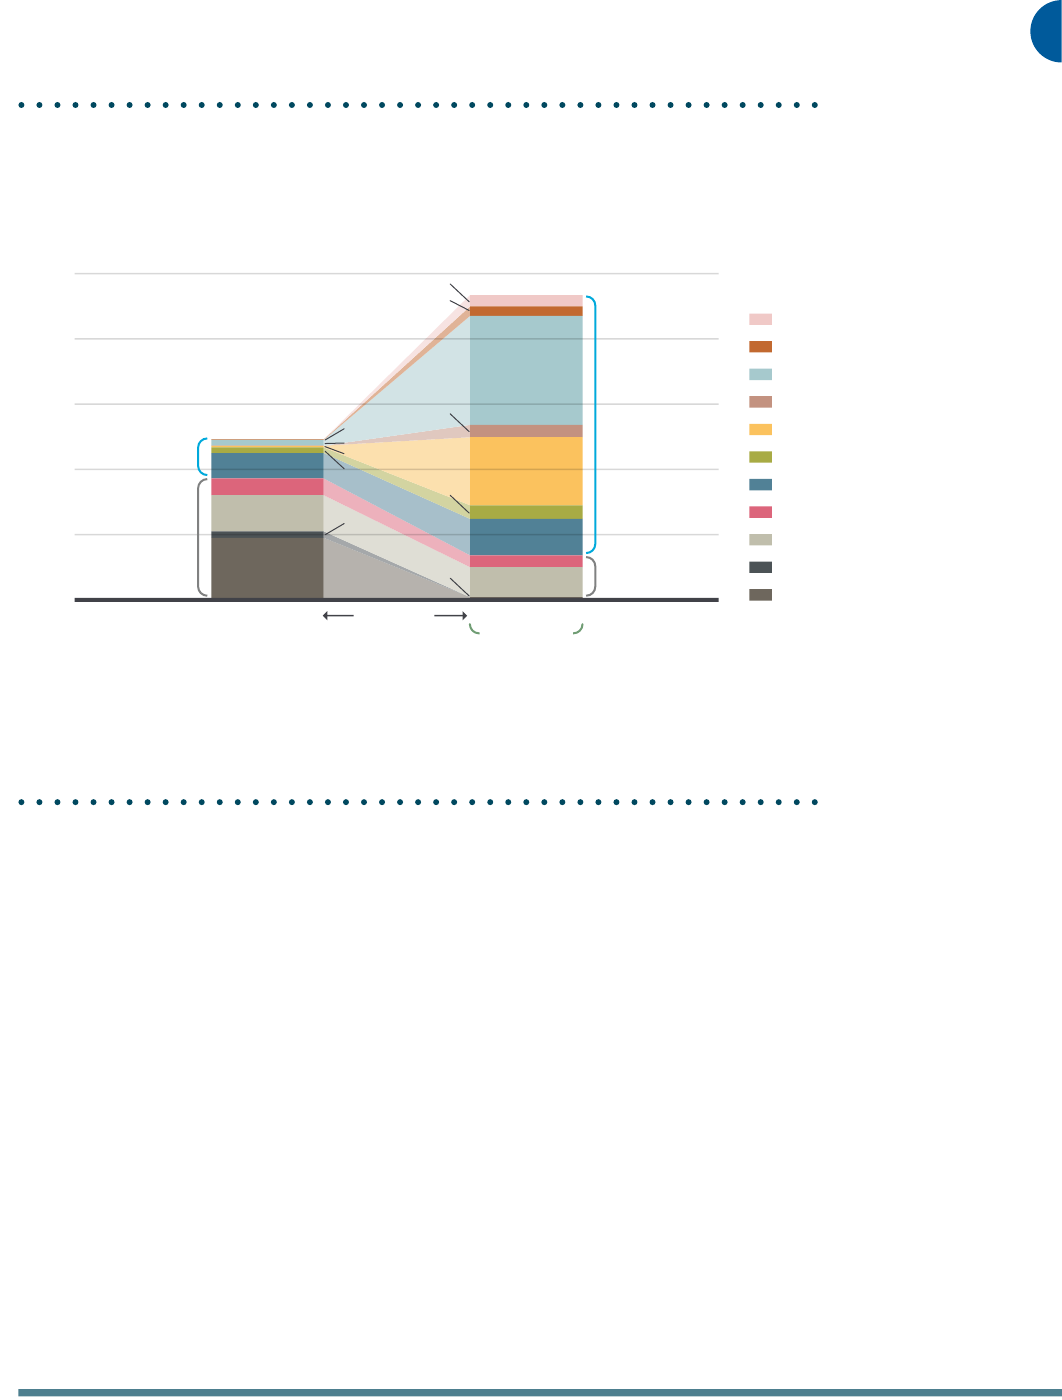
0
10 000
20 000
30 000
40 000
50 000
20502015
Electricity generation (TWh/yr)
Others (incl. marine and hybrid)
Geothermal
Wind
CSP
Solar PV
Bioenergy
Hydropower
Nuclear
Natural gas
Oil
Coal
REmap Case
2015-2050
changes
RenewablesRenewables
Non-RenewablesNon-Renewables
85%
15%
RenewablesRenewables
Non-RenewablesNon-Renewables
24%
76%
39%
23%
10%
16%
22%
36%
10%
4%
12%
<1%
3.5%
1%
3.5%
4%
4%
4%
4%
1%
3%
ANALYSIS AND INSIGHTS IN KEY SECTORS
KEY SECTORS: POWER
USD 250 billion per year more than business-as-usual (the Reference Case). In all, investment in
decarbonisation of the power system will need to reach an average of nearly USD 1 trillion per
year to 2050.
For power generation using renewables, the Reference Case would require total investment of
USD 8 trillion between 2015 and 2050. The REmap’s decarbonisation options would double that to
nearly USD 16 trillion. Much of the additional investments are required to deploy variable renewables
such as wind onshore (33%), solar PV (31%), and concentrated solar power (CSP) (12%). As the
share of renewable energy in electricity generation rises, investments will be needed for storage,
transmission and distribution capacity, and for flexible generation and demand-response. Between
2015 and 2050, investments in these areas would add an estimated USD 9 trillion under the REmap
Case (relative to the Reference Case). This investment would allow the system to accommodate
62% VRE while ensuring an adequate, stable and reliable electricity supply. Cumulatively, the
investment needs of the power sector (beyond generation capacity) reach USD 18 trillion by 2050
under the REmap Case. This is double the investment that is projected under the Reference Case.
In terms of fossil fuel power generation, between 2015 and 2050 the REmap Case would save around
USD 2 trillion compared to the Reference Case, because it accelerates use of renewables and
promotes higher efficiency.
Figure 15. The rising importance of solar and wind energy in the power sector
Breakdown of electricity generation, by source (TWh/yr)
Gross power generation will almost double with renewable
energy providing 85% of electricity.
39
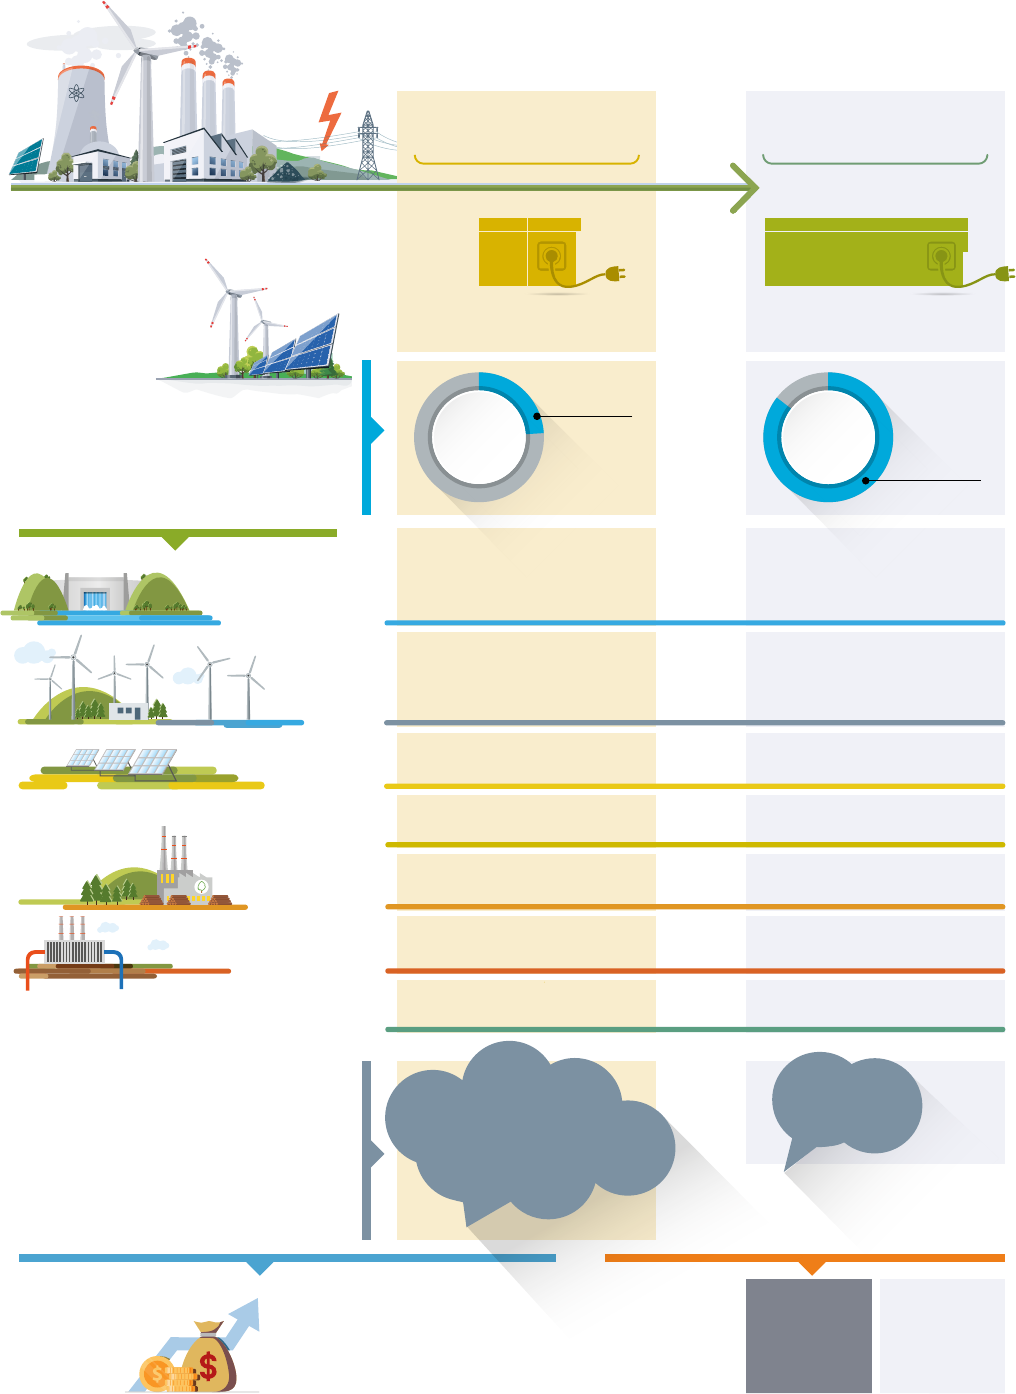
Indicators for energy use
in the Power sector
20 204
24% 85%
HYDROPOWER
TWh/yr
41 508
TWh/yr
Electricity
demand
Renewable
share
Renewable
share
SOLAR PV
RENEWABLE ENERGY SHARE
IN TOTAL ELECTRICITY GENERATION
BIOENERGY
CSP
GEOTHERMAL
OTHERS (incl. marine, hybrid)
of which
pumped hydro
GW
GW
GW
GW
GW
GW
GW
GW
GW
GW
155
325
1 248
1 828
GW GW
GW GW
GW GW
GW GW
GW GW
223 7 122
5
633
119
384
10
227
0.3
881
WIND
Onshore
Oshore
399
12
4 923
521
411 5 445
1
USD trillion USD trillion
USD trillion
24.6
RENEWABLE ENERGY INDICATORS
INVESTMENT
R POWER
GENERATION
18
R POWER SYSTEM
FLEXIBITLITY AND GRID*
STRANDED
ASSETS
1.9Gt CO
2
/yr
REmap Case 2050
1.4
USD trillion
Delayed Policy Action
12.4 Gt CO
2
/yr
ENERGY RELATED
CO
2
EMISSIONS
Avoided CO
2
emissions
in 2050 compared
to Reference Case:
Gt CO
2
/yr
8.8
Total investments
for decarbonisation
for the period
2015-2050
* This includes investments needed for transmission and distribution grid expansion,
increased generation flexibility, electricity storage.
for the period
2015-2050
POWER
REmap Case 20502015
ANALYSIS AND INSIGHTS IN KEY SECTORS:POWER
Figure 16. Infographic Power
40
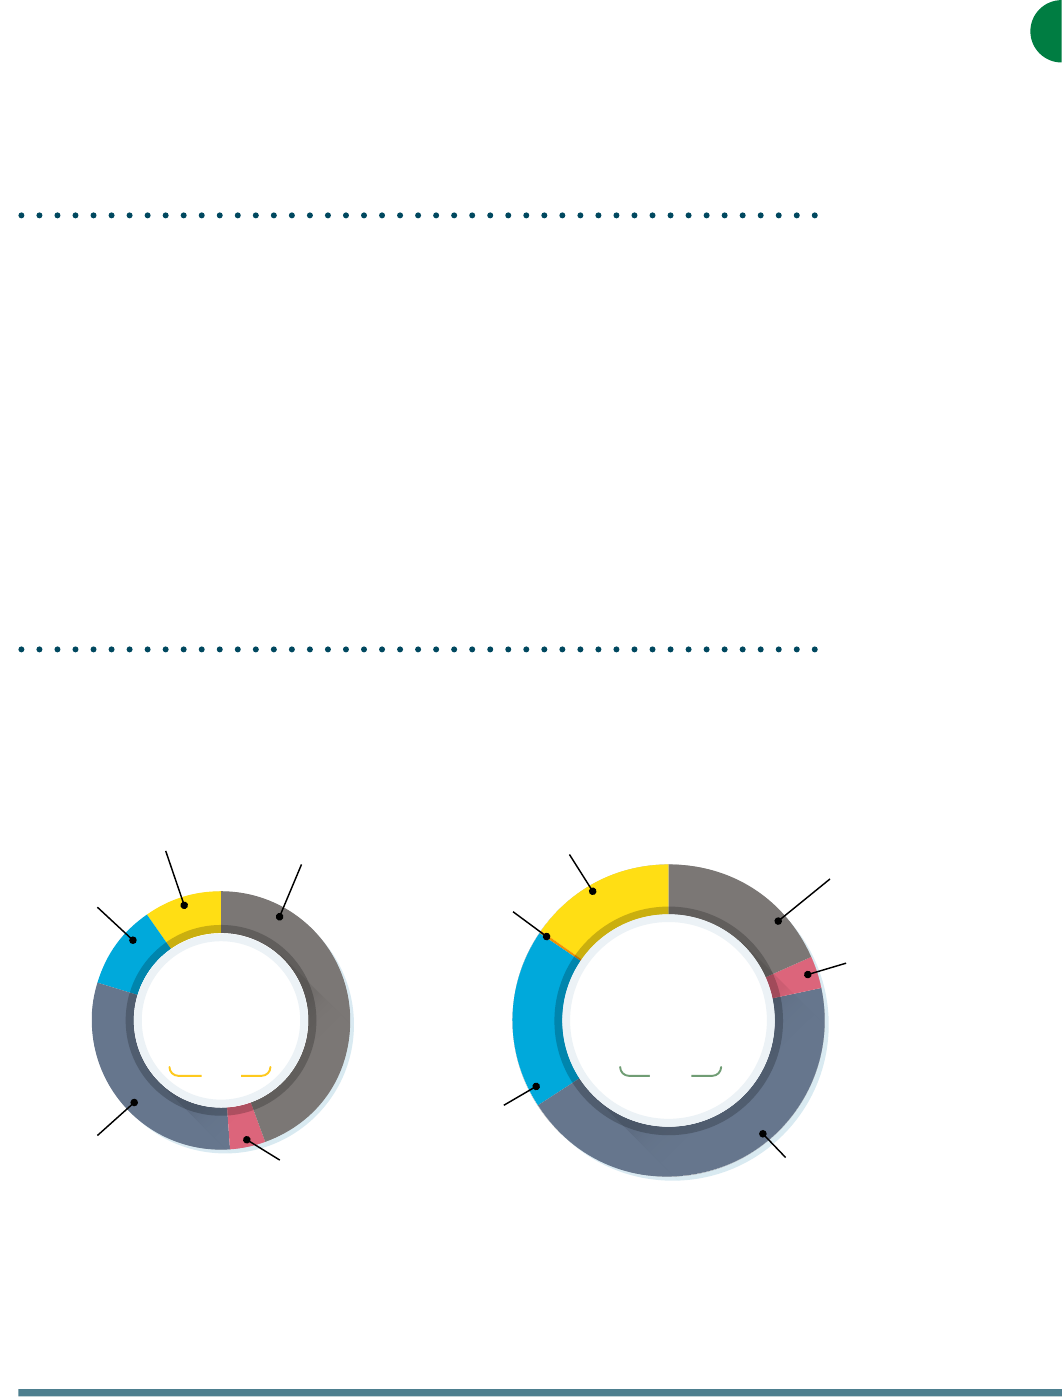
Reference Case energy sector investments
between 2015-50 (USD trillion)
REmap Case energy sector investments
between 2015-50 (USD trillion)
CCS & others; 0.5
Renewable
energy; 9.6
Energy
eciency; 29
Nuclear; 3.7
93
USD trillion
Power grids and flexibility; 18
Renewable
energy; 22.3
Energy eciency; 53
Nuclear; 3.6
Fossil fuels; 22.3
120
USD trillion
Power grids and flexibility; 9
Fossil fuels; 42
Reference
Case
REmap
Case
COSTS, INVESTMENTS AND REDUCED EXTERNALITIES
Figure 17. Investment will need to shift to renewable energy and energy eciency
Cumulative investment - Reference and REmap cases, 2015-2050 (USD trillion)
Under the REmap Case, cumulative investment of USD 120 trillion
must be made between 2015 and 2050 in low-carbon technologies,
averaging around 2.0% of global GDP per year.
COSTS, INVESTMENTS AND
REDUCED EXTERNALITIES
OF THE ENERGY TRANSITION
The energy transition is technically feasible and economically beneficial, but will require
substantial additional investment in low-carbon technologies compared to current and
planned policies (the Reference Case). Between 2015 and 2050, cumulative investment in the
energy system will need to increase from USD 93 trillion (under the Reference Case) to USD 120
trillion (under the REmap Case) (Figure 17). Additional investment of USD 27 trillion over the
period will be needed.
Under the Remap Case, investments in renewable energy and energy efficiency would compose
the bulk of total energy investments (USD 75 trillion). These would nearly double relative to the
Reference Case. USD 20 trillion would be diverted from investment in fossil fuels to investment
in renewable energy and efficiency. Additionally, USD 18 trillion would need to be invested in the
power grid and in energy flexibility. In total, between 2015 and 2050, the global economy would
need average investments equivalent to some 2.0% of global GDP per year in decarbonisation
solutions, including renewable energy, energy efficiency and other technologies.
41

0
1
2
3
4
6
5
9
7
8
10
Net benefits
USD 4.6 trillion
Costs
USD 1.7 trillion
Benefits from reduced
externalities
USD 6.3 trillion
USD trillion
Externalities
range
High
Low
Average
+
-
COSTS, INVESTMENTS AND REDUCED EXTERNALITIES
Figure 18. Reduced negative externalities far outweigh the costs of the energy transition
Annual costs of the energy transition set against reduced externalities (air pollution and
CO
2
damage) - REmap Case compared to the Reference Case, 2050 (USD trillion)
Under the REmap Case, annual health and CO
2
benefits
associated with the energy transition outweigh incremental costs
by 2 to 5 times in 2050.
Combined with reduced fuel expenditures, these increased investments in renewable energy and
infrastructure over the period to 2050 make it possible to calculate how the cost of the entire
energy system would change. The result of this transformation would be a slight annual increase in
energy system costs, amounting to USD 1.7 trillion in 2050, or about 0.5% of global GDP in that year.
The increase is largely due to infrastructure investments.
However, cost savings significantly outweigh the increase in energy system costs. Cost savings
would be made, in particular, because air pollution would decline, lowering health costs, and
environmental damage due to CO
2
would lessen. Gains in human health (a fundamental driver of
energy policy in many countries) and lower CO
2
emissions from fossil fuels would generate savings
(on average) of USD 6 trillion annually by 2050, an amount that is over three times larger than the
additional cost of decarbonisation. If the higher end estimate is used, then cost savings would be
as much as five times larger than the additional cost of decarbonisation (Figure 18). Moreover,
these economic benefits do not take into account the additional benefits of renewable energy
deployment and energy efficiency, which include lower water consumption, job creation, and
higher GDP. The analysis also suggests that there would be a general improvement in welfare (see
global welfare discussion).
42

COSTS, INVESTMENTS AND REDUCED EXTERNALITIES
Energy subsidies and externalities cause many misconceptions about the costs of the energy
transition. In 2016, subsidies to fossil fuels exceeded those to renewables by a factor of between
two (not counting externalities) to thirty-eight (including externalities) (Coady et al., 2015;
IEA, 2017). IRENA estimates that supply-side renewable energy subsidies will be required in the early
stages of the energy transition in different sectors to drive deployment and reduce costs, given the
lack of adequate pricing of the externalities of fossil fuels (e.g., local pollutant and CO
2
emissions)
but as renewable options become cheaper than fossil fuel options, these subsidies decline and are
eventually replaced by net-economic benefits (before taking into account the cost of pollutants,
which would result in even larger benefits). Reflecting the greater progress in deploying renewables
in power generation, this sector currently accounts for the largest share of subsidies. However,
the cost of power generation subsidies will decline rapidly in many countries, because renewable
energy technologies are already, or will soon become, cost competitive. However, as other sectors
are decarbonised, subsidies to accelerate deployment and drive down costs in the transport and
industry sectors grow as they start to decarbonise.
To reduce the risk of stranded assets, action has to be taken quickly and investments must
be channelled into the right energy technologies. The slow progress of emission mitigation
to date means that the adoption of an emissions mitigation path in the REmap Case will still
result in stranded assets worth more than USD 11 trillion. The amount is substantial; it equals
about one third of additional investment needs or around 3% of today’s global capital stock.
However, delaying decarbonisation of the energy sector by another 15 years would make the
energy transition more expensive and would double the assets stranded between today and 2050.
In addition, delaying action could make it necessary to adopt costly technologies to remove carbon
from the atmosphere (negative emission technologies, such as bioenergy with carbon capture
and sequestration) in order to stay within the emissions envelope (for more information about the
carbon budget assumed for this analysis, please see IEA and IRENA, 2017).
43
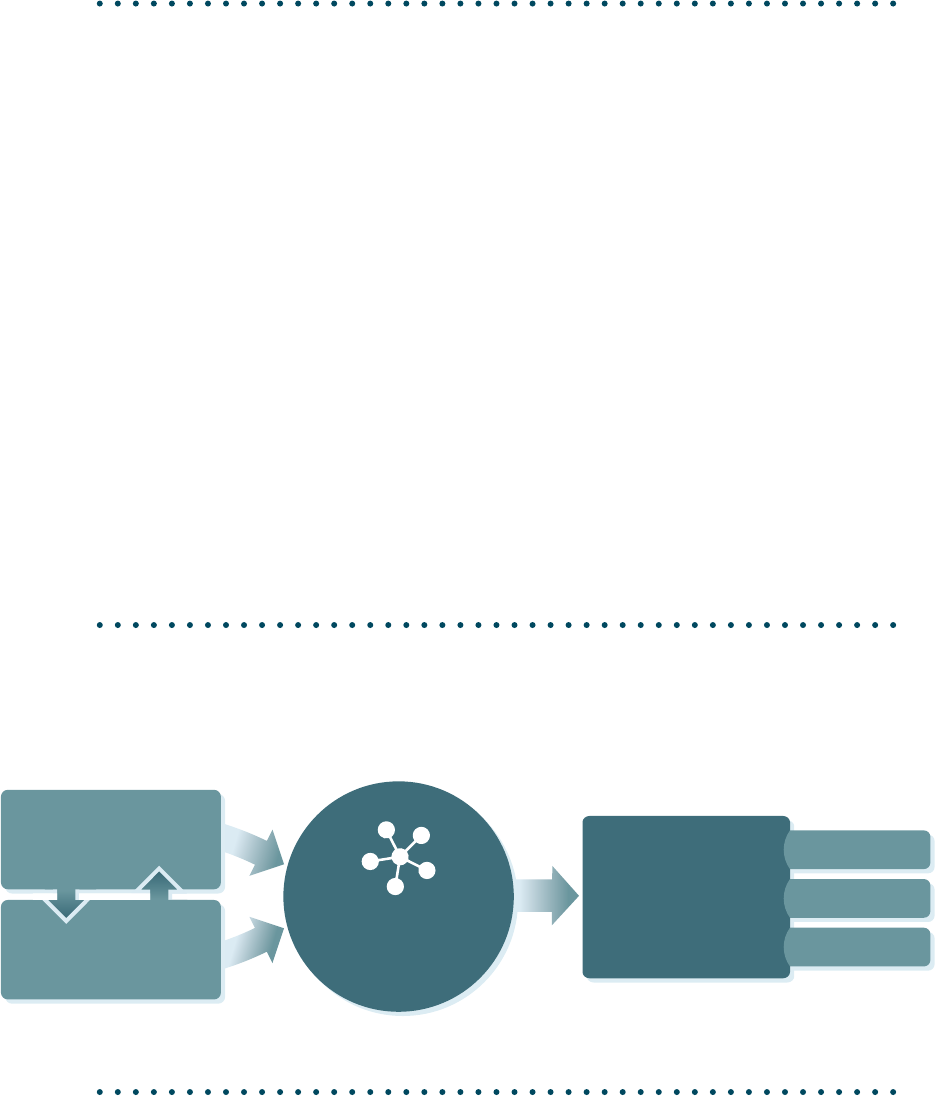
Energy transition
roadmap
Energy transition
roadmap
Socio-economic
system outlook
Socio-economic
system outlook
Energy-economy-
environment
model
Socio-economic
footprint
GDP
Employment
Welfare
SOCIO-ECONOMIC BENEFITS
Figure 19. Obtaining the socio-economic footprint from a given combination of an
energy transition roadmap and a socio-economic system structure and outlook
SOCIO-ECONOMIC
BENEFITS OF THE
ENERGY TRANSITION
The need to bring economic and environmental objectives into closer alignment, and in particular
to reduce the climate impacts of a fossil fuel-based world economy, is prompting a profound
restructuring of the energy system. This change is made possible by increasingly mature and
competitive renewable energy and energy efficiency technologies that change the ways in which
electricity, heat and fuels are produced and consumed. However, the energy transition cannot
be considered in isolation from the broader socio-economic system. In fact, the changes in the
energy system triggered by the REmap transition roadmap have impacts throughout the broader
economy.
The close interplay between the energy sector and the economy alters the socio-economic
footprint and generates a number of benefits in terms of GDP, employment and human welfare
(Figure 19). The analysis of the drivers and dynamics underpinning this outcome provides valuable
insights into how the overall transition process could be improved.
As is the case with any economic transition, there will be regions and countries that fare better
than others due to diverging structures, capacities and dynamics. Policymakers can help to make
the transition process a just one by initiating economic diversification investments, supporting
initiatives that help build and strengthen domestic supply chains capable of responding to new
economic opportunities, adopting social protection measures for people dependent on declining
industries (including fossil fuels), and by supporting the transition in the context of energy access
(see Box 2).
44

SOCIO-ECONOMIC BENEFITS
Box 2 Energy access and the transition
In 2000, 1.7 billion people lacked access to electricity. While 1.2 billion people have gained
access since then, 1.1 billion people continue to live without electricity (95% of them live in
Sub-Saharan Africa and Asia). Based on current trends and policies, 680 million people would
still lack access to electricity in 2030 (80% of them in rural areas of sub-Saharan Africa),
implying failure to achieve the United Nations (UN) Sustainable Development Goal 7 (SDG 7).
To provide electricity for all by 2030 would require annual investment of some USD 52 billion
per year in power generation and infrastructure, equal to 3.4% of average annual global energy
sector investment.
To realise the energy transition successfully will require to change the entire socio-economic
system, and make inclusiveness one of its pillars. Social fairness and justice are among the most
important ideas that will drive energy access during the transition. But they are relevant for
more pragmatic reasons too. If access is not universal, the transition will remain incomplete,
and the disequilibrium in socio-economic organisation would ultimately undermine efforts to
achieve global sustainability and climate goals.
Access in a transition context goes well beyond energy access:
n
Access to services requires more integrated approaches that search for synergies between
renewable energy and energy efficiency, and promote socio-economic activity including its
welfare implications.
n
Holistic planning is required to facilitate the organic evolution of infrastructures (off-grid,
mini-grid, grid) and socio-economic structures, and to avoid stranding assets and resources
that are needed and scarce.
n
The transition will not be complete until all regions and communities have access to services.
The energy implications of this position go well beyond providing basic energy to populations
that still lack access to it. It requires planning for the full and universal integration of services.
n
Financing also plays an important role in access. Novel business models and social financing
initiatives already facilitate access, but further action is required in all public, private and
community forums.
Cost reductions and advances in technology have enabled off-grid renewable energy solutions
to become a mainstream option for expanding electricity access. The off-grid renewable energy
sector has been transformed in the last decade. The private sector is increasingly engaged,
driving business and financing technology innovations that bring down costs and make off-
grid solutions more accessible to rural communities. Other enabling factors, such as payment
digitisation and remote monitoring, are also contributing to the accelerated deployment of
off-grid solutions.
Renewable energy solutions offer a clear pathway for accelerating progress towards SDG 7, as
well as a more complete energy transition, in an affordable, environmentally-sustainable and
equitable manner. Their role in national electrification strategies needs to be recognised and
holistically planned so that the public and private sectors, financing institutions, communities
and civil society can collectively transform energy services in underserved areas.
To further accelerate access to renewable energy requires an enabling environment. This
needs to include well designed policies and regulations, customised business and financing
models, adapted and appropriate technology solutions, capacity building, and dedicated
platforms for sharing best practices and lessons learned. Gender, local community engagement
and productive end-use support are equally important to the sustainability of projects and
initiatives, and the achievement of fair outcomes.
45
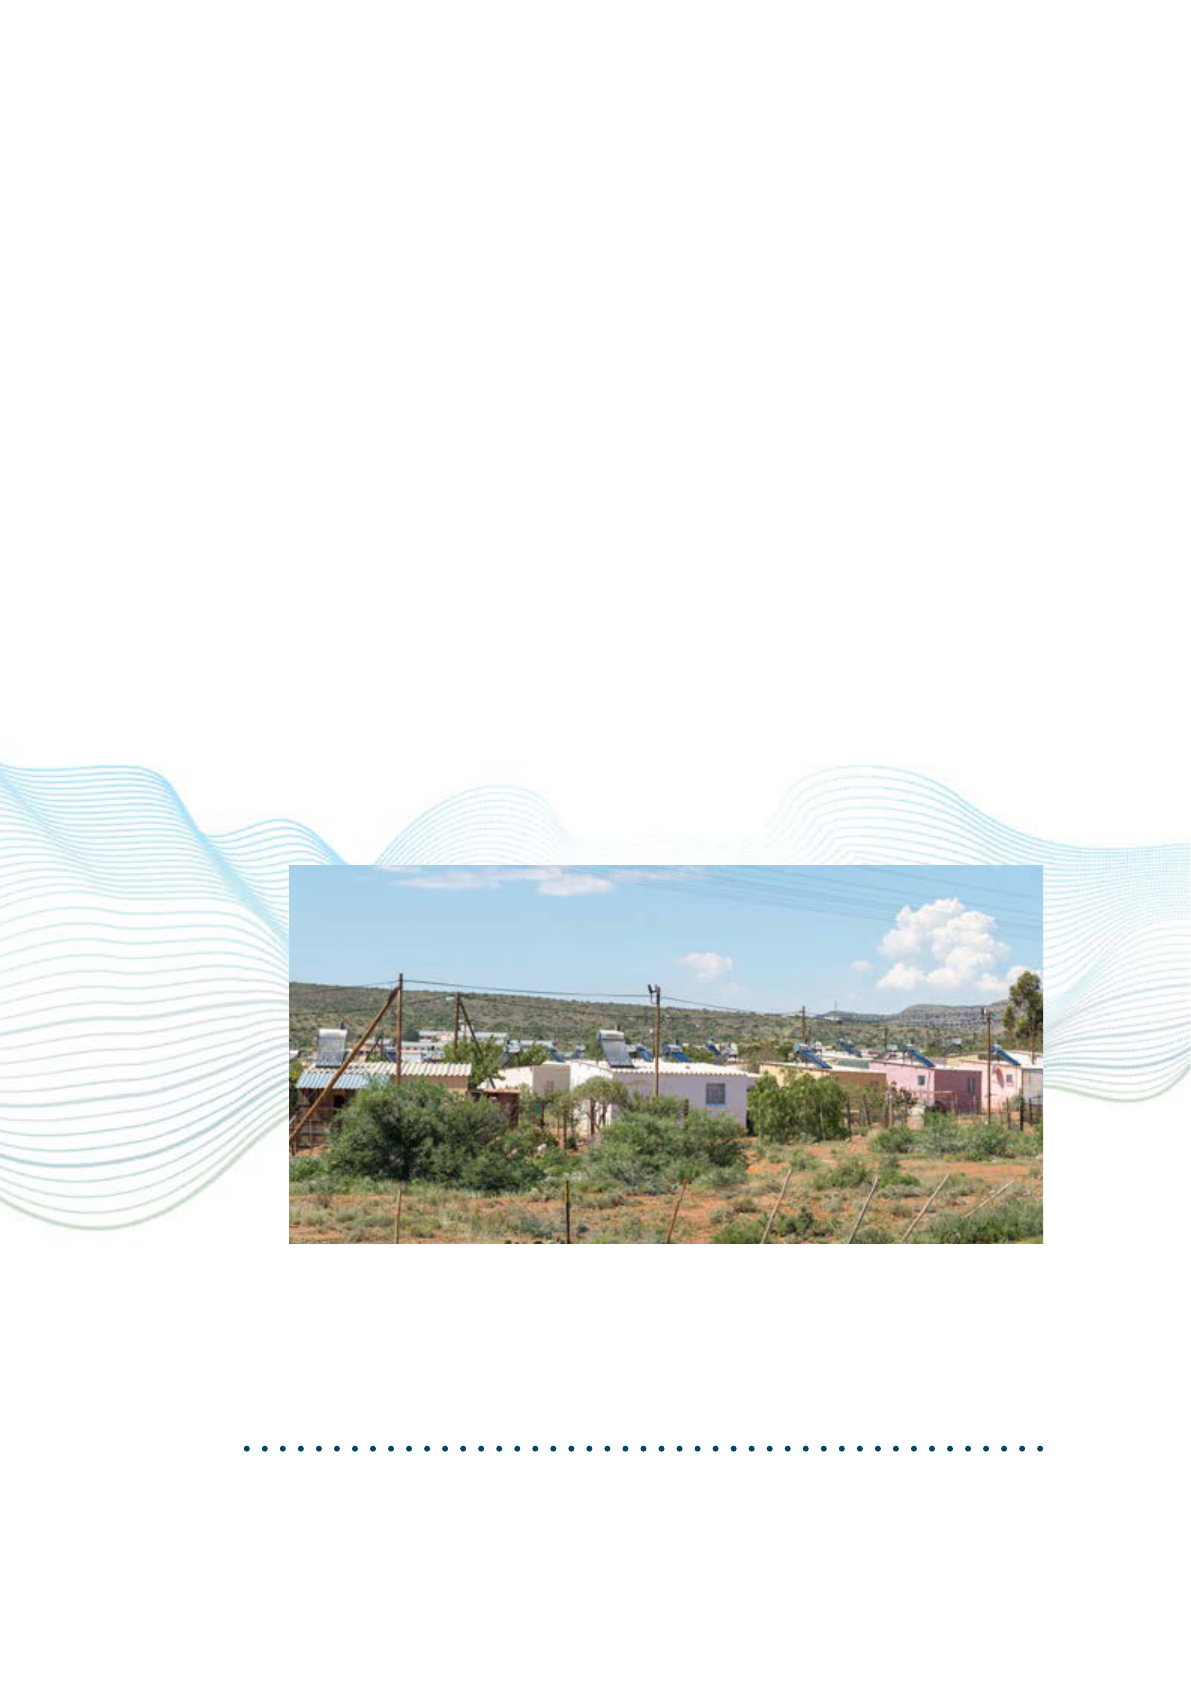
SOCIO-ECONOMIC BENEFITS
2 To perform this analysis, the E3ME energy-economy model from Cambridge Econometrics has been applied.
The E3ME is a global macro-econometric model with regional and sectorial resolution that captures the diverse
interactions between the energy and economy systems.
The analysis presented in this section builds on IRENA’s body of work focusing on measuring the
economics and benefits of the energy transition and renewable energy employment (IEA and
IRENA, 2017; IRENA, 2018d, 2017d, 2017g, 2017h). The analysis delves into macroeconomic variables
to present the socio-economic footprint of the REmap roadmap, both at global and regional level,
as deployed on the current socio-economic system.
2
The main macroeconomic drivers used to analyse the GDP and employment footprints include
investment, trade, tax changes, indirect and induced effects. In the case of employment, the
‘consumer expenditure’ driver combines the impacts from taxes, indirect and induced effects,
while capturing other labour-related dynamic effects. In different regions, these drivers interact
with region-specific socio-economic systems, leading to diverging transition outcomes.
The transition provides socio-economic benefits that go well beyond what GDP can measure.
Regarding employment outcomes, details are also presented for the energy sector, and its
components (e.g., renewables, energy efficiency, grids upgrade and energy flexibility). A welfare
indicator encompassing economic, social and environmental dimensions is used to quantify
the broader transition impact. Financing the transition is a cornerstone of the socio-economic
system’s outlook. An analysis of the role of finance is presented, highlighting its interactions with
the socio-economic system, as well as the potential finance-related transition barriers and how
to address them.
46

20502045204020352030202520202015
0.0
0.5
1.0
1.5
% dierence in GDP from Reference Case
Changes in trade
Indirect and induced eects
Changes in consumer expenditure due to tax rate changes
Changes in investment
Change in GDP
SOCIO-ECONOMIC BENEFITS
GLOBAL GDP
Across the world economy, GDP increases from 2018 to 2050 in both the reference and transition
scenarios. However, the energy transition stimulates economic activity additional to the growth that
could be expected under a business as usual approach. The cumulative gain through increased
GDP from 2018 till 2050 will amount to USD 52 trillion.
The GDP transition footprint for the world is presented in Figure 20, which shows that the REmap
energy transition has a consistently positive effect on global GDP between 2018 and 2050,
compared to the reference scenario. The gain over the Reference Case is greatest in 2031, peaking
at 1.5% of GDP, and then gradually narrows to 1.0% in 2050. The reference scenario has a compound
annual growth rate between 2018 and 2050 of 3.0%. The per capita world average GDP for the
transition scenario increases from 10,800 USD (in constant 2015 dollars) in 2018 to 22,400 USD in
2050. Figure 20 also quantifies the contributions to GDP of four major drivers (investment stimulus,
trade effects, tax shifts and indirect/induced effects).
The first positive impact on GDP is due to a net investment stimulus in renewables, energy efficiency,
grids and energy flexibility. First, changes in tax rates, mainly associated with carbon taxes and the
phase-out of fossil fuels, boost GDP growth in the medium term. Second, after a dynamic time-lag,
indirect and induced effects take over and have a positive impact on GDP in the second half of the
energy transition (to 2050 and beyond). As expected global trade has a minor impact on the global
GDP increase throughout the whole transition, given the intrinsic requirement of global trade being
balanced in nominal terms.
Figure 20. The energy transition results in GDP growth higher than the Reference Case
between 2018 and 2050
Relative dierence of global GDP between the REmap Case and the Reference Case,
2018-2050
GLOBAL GDP
47

+0.31% +0.15%
1 INVESTMENT
+0.10% +0.03%
2 TRADE
+0.76% +0.27%
3 TAX RATES
+0.22% +0.54%
4 INDIRECT AND INDUCED EFFECTS
-0.01% -0.07%
5 INVESTMENT
0.00% -0.05%
6 TRADE
+0.22% +0.26%
CONSUMER EXPENDITURE
compared to the
Reference case
in 2050
compared to the
Reference case
in 2030
compared to the
Reference case
in 2050
compared to the
Reference case
in 2030
compared to the
Reference case
in 2050
compared to the
Reference case
in 2030
compared to the
Reference case
in 2050
compared to the
Reference case
in 2030
compared to the
Reference case
in 2050
compared to the
Reference case
in 2030
compared to the
Reference case
in 2050
compared to the
Reference case
in 2030
compared to the
Reference case
in 2050
compared to the
Reference case
in 2030
The investment stimulus is the main initial driver of improvement
in global GDP during the energy transition. Over time, the relative
contribution of investments to GDP growth declines. High values
in 2018 steadily reduce over the first half of the transition period.
This is explained by two factors. First, under the Reference Case,
investment increases in later years, lowering the relative impact
of the driver. Second, a small proportion of existing capacity is
retired in the early years, so that most of the early investment in
renewables is additional.
Figure 20 shows the net investment effect with respect to three main sub-drivers: (i) energy
efficiency; (ii) the power sector, including generation, transmission and distribution (T&D) grids,
and energy flexibility; and (iii) other investments in the economy, including investments required
for upstream supply of fossil fuels, and the impact of crowding out of capital.
Net investment is initially dominated by investment in energy efficiency measures, although this
contribution steadily declines under the REmap Case because it is expressed relative to investments
that increase energy efficiency under the Reference Case. The impact of investment on GDP in the
power sector is relatively small initially, because it measures the net effect of higher investment in
renewables and lower investment in fossil fuel energy generation. Its contribution is rather steady
and, under the REmap Case, increases in the second half of the period. This increase is due to
investments in T&D and flexibility, which play a growing role in power sector investment over the
period to 2050. The contribution of other investments in the economy is negative throughout the
transition period due to foregone investments in upstream fossil fuels and the crowding out effect.
Global trade has a very small impact on GDP throughout the
transition, because of the intrinsic requirement to balance global
trade in nominal terms (imports in some regions are directly linked
to exports in others). The small positive differences stem from the
application of country-specific deflators to convert investment
from nominal to real terms, which leads to some discrepancies
between total imports and exports at a global scale. Trade,
however, will have important impacts on GDP at regional level.
The tax rate driver is one of the main contributors to global GDP
increases during the transition period. Its contribution is higher
in the 2025–35 period, mainly due to carbon tax revenues which
peak around 2030. Thereafter, some major economies (including
China) start to cut carbon emissions rapidly, reducing government
revenue from carbon taxes. On the negative side, loss of fossil fuel
tax revenues (in countries that produce oil and gas) drags down
tax revenue as global final demand for fossil fuels falls. As Figure
20 shows, this effect is completely compensated by the positive
effects of tax rate changes.
Indirect and induced effects play the largest role in driving
global GDP increases under the REmap Case in the second
half of the transition period. This reflects reduced expenditure
on energy (particularly fossil fuels) and reallocation of this
spending to other parts of the economy. Larger supply chains
lead to increased indirect effects, and more wages lead to
induced effects. As more money is reallocated from energy to
other goods and services, benefits increase accordingly. The
deployment of energy efficiency measures (which reduce energy
consumption permanently), therefore, drives a steady increase in
the contribution of indirect and induced effects.
+0.31% +0.15%
1 INVESTMENT
+0.10% +0.03%
2 TRADE
+0.76% +0.27%
3 TAX RATES
+0.22% +0.54%
4 INDIRECT AND INDUCED EFFECTS
-0.01% -0.07%
5 INVESTMENT
0.00% -0.05%
6 TRADE
+0.22% +0.26%
CONSUMER EXPENDITURE
compared to the
Reference case
in 2050
compared to the
Reference case
in 2030
compared to the
Reference case
in 2050
compared to the
Reference case
in 2030
compared to the
Reference case
in 2050
compared to the
Reference case
in 2030
compared to the
Reference case
in 2050
compared to the
Reference case
in 2030
compared to the
Reference case
in 2050
compared to the
Reference case
in 2030
compared to the
Reference case
in 2050
compared to the
Reference case
in 2030
compared to the
Reference case
in 2050
compared to the
Reference case
in 2030
SOCIO-ECONOMIC BENEFITS
48

20502045204020352030202520202015
0.0
0.1
-0.1
0.2
0.3
% dierence in employment from Reference Case
Changes in trade
Changes in investment
Changes in consumer expenditure, including due to tax rates, indirect and induced eects
Changes in employment
EMPLOYMENT IN THE GLOBAL ECONOMY
Across the world economy, employment increases between 2018 and 2050 under both the
Reference and REmap cases. In the Reference Case, the compound annual growth during the
period is 0.42% per year. In 2050, the aggregate gain in employment is around 0.14% higher under
the REmap Case than under the Reference Case.
The employment effects are less significant than GDP effects (1.4% and 1%, in 2030 and 2050,
respectively) because additional demand in the global economy also pushes up real wages. The
additional wages available in the sector as a result of additional demand can be realised as increases
in wages for all workers, or increases in the number of jobs (or a mix of the two). Historical trends
show that wage effects tend to dominate, leading to smaller increases in employment than GDP.
Figure 21 shows the drivers behind the stronger growth in employment under the REmap Case
relative to the Reference Case. These include investment, trade and consumer expenditure.
Figure 21. The energy transition results in employment growth higher than the Reference Case
between 2018 and 2050
Relative dierences in global employment - REmap Case and Reference Case,
disaggregated by three main drivers
EMPLOYMENT IN THE GLOBAL ECONOMY
SOCIO-ECONOMIC BENEFITS
49

+0.31% +0.15%
1 INVESTMENT
+0.10% +0.03%
2 TRADE
+0.76% +0.27%
3 TAX RATES
+0.22% +0.54%
4 INDIRECT AND INDUCED EFFECTS
-0.01% -0.07%
5 INVESTMENT
0.00% -0.05%
6 TRADE
+0.22% +0.26%
CONSUMER EXPENDITURE
compared to the
Reference case
in 2050
compared to the
Reference case
in 2030
compared to the
Reference case
in 2050
compared to the
Reference case
in 2030
compared to the
Reference case
in 2050
compared to the
Reference case
in 2030
compared to the
Reference case
in 2050
compared to the
Reference case
in 2030
compared to the
Reference case
in 2050
compared to the
Reference case
in 2030
compared to the
Reference case
in 2050
compared to the
Reference case
in 2030
compared to the
Reference case
in 2050
compared to the
Reference case
in 2030
Investment plays a positive role in increasing employment in
the short term, contributing up to 0.06% in relative additional
employment in 2020. Investments in energy efficiency dominate
initially but their impact gradually falls over time. Investments
in the power sector gradually emerge to become the dominant
factor behind employment creation after 2040. In the power
sector, the number of jobs created by renewables, T&D grids and
energy flexibility is significantly greater than the number of jobs
foregone in the fossil fuel power sector. However, the number of
jobs lost as a result of foregone fuel extraction gradually increases
during the period. Together with jobs lost from investment in
other parts of the economy (partly due to crowding out), these
job losses come to offset the positive investment contributions
from 2030 onwards.
Trade. Although in GDP terms global changes in trade are
balanced, this is not the case for employment. The transition
results in several shifts in trade: a sectoral shift (trade moves
from fossil fuels to non-energy trade); a regional shift (importers/
exporters change roles as their relative competitiveness is
modified by transition impacts on relative energy prices and
domestic supply chains); and a volume shift (where the volume
of global trade can be modified). Each of these can significantly
affect global trade, according to the characteristics of the energy
transition and evolution of the socio-economic system. Under
the REmap Case, trade initially promotes a positive but limited
increase in employment; but this becomes negative after 2030
and significantly negative by 2050. This effect is due to two
factors: trade in fossil fuels and non-energy trade. The latter is
responsible for the employment downturn around 2030 and the
overall negative impact on jobs by 2050.
Consumer expenditure is the dominant driver throughout the
transition period, with three trends influencing the final results:
(i) wage effects cause small decreases in employment in most
years (in other words, increases in wage rates discourage firms
from hiring workers); (ii) consumer expenditures continuously
increase over the transition period, leading to higher demand
for workers (to meet the additional demand for goods and
services); and (iii) dynamic employment effects in the labour
market, for example when firms pause hiring until they confirm
that increases in production are sustained or are falling, or delay
hiring in order to meet contractual notice periods, etc. These
dynamic effects primarily reflect lagged outputs (i.e., when
an economy expands, employment will increase in later years
rather than in the year when output started to grow).
SOCIO-ECONOMIC BENEFITS
50

GLOBAL ENERGY SECTOR EMPLOYMENT
SOCIO-ECONOMIC BENEFITS
GLOBAL ENERGY SECTOR EMPLOYMENT
The energy transition will increase employment not just in the broader economy, but specifically
in the energy sector and in renewable energy. As shown in Figure 22, the global energy sector
employed some 41 million people in 2016. This number includes jobs in the fuel supply and power
sectors, but not in energy efficiency and grid enhancement,
3
for which no 2016 estimates are
available. The number of fossil fuel jobs lost by the milestone years 2030 and 2050 is completely
offset by the number of jobs created in renewable energy technologies. In addition, investments
in energy efficiency measures and grid enhancement create further employment opportunities.
Under the Reference Case, a slight decline in fossil fuel employment by 2030 is compensated by
a 28% increase in renewable energy jobs. By 2050, renewable energy adds more jobs, while the
number of fossil fuel jobs remains roughly the same as in 2030.
Outcomes under the REmap Case are much better, because investment is higher in labour
intensive technologies, including renewable energy and energy efficiency. In 2030, employment
in renewables and energy efficiency together increases by around 70% (relative to the Reference
Case), reaching 23.6 million and 25.3 million respectively. In fact, energy efficiency employs more
people than either renewables or fossil fuel technologies. Under the REmap Case, total employment
in the energy sector reaches 85 million in 2030, 25% more than under the Reference Case.
In 2050, total energy sector employment under both the Reference and REmap cases is lower than
in 2030. To some extent, this is due to increasing labour productivity in all technologies. However,
energy efficiency employment declines because much of the investment is front-loaded and then
tapers off over time. Jobs in renewable energy, on the other hand, continue to increase under both
the Reference and REmap cases, because of continued investments in the sector.
In sum, the analysis concludes that, compared to the Reference Case, by 2050 the energy transition
would lead to a loss of 7.4 million direct and indirect jobs in fossil fuels, but a simultaneous gain of
19.0 million jobs in renewable energy, energy efficiency, and grid enhancement. Implementing the
REmap Case would therefore result in a net gain of 11.6 million jobs.
The results show that, under the Reference Case, employment in the renewable energy sector could
reach 12.5 million by 2030 and 14.9 million in 2050, up from current levels of 9.8 million (see Figure
23) (IRENA, 2017d). However, employment in the renewable energy sector, under the REmap Case,
could potentially double to reach 23.7 million by 2030 and 28.8 million by 2050.
Employment in the renewable energy sector
in 2030 is expected to remain concentrated in
the technologies used today (solar, bioenergy,
hydropower and wind), with minor shifts
depending on circumstances. Most renewable
energy employment under the REmap Case
would be in bioenergy (9.1 million jobs by 2030
and 11.3 million jobs by 2050), solar (8.5 and
11.9 million, respectively), hydropower (3.8 and
3.6 million, respectively) and wind (2.2 and 2.0
million, respectively).
3 Grid enhancement includes transmission and distribution systems and investments in energy flexibility that enable
renewable energy to be integrated in the power system.
51
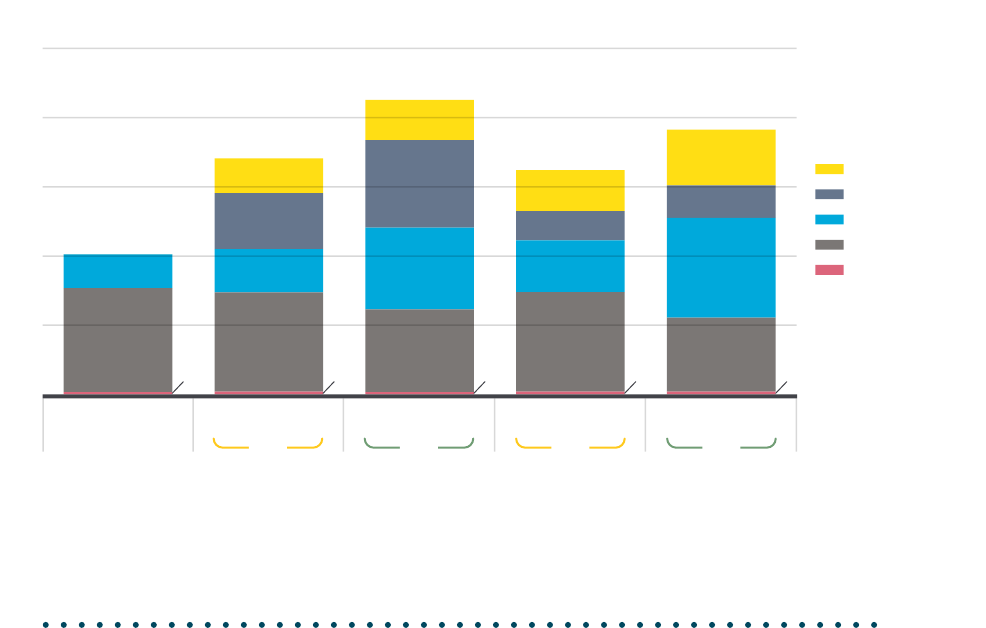
Million jobs
0.7
30
9.8
0.8 0.7 0.8 0.8
28.7
12.5
16.2
10.0
23.9
23.6
25.3
11.6
28.8
14.9
8.5
11.8
21.4
28.8
9.4
16.1
Grid Enhancement**
Energy Eciency
Renewables
Fossil Fuels***
Nuclear
40.5
68.2
85.0
64.8
76.5
2030
REmap
Case
2030
Reference
Case
2050
REmap
Case
2050
Reference
Case
0
20
40
60
80
100
2016 - Estimate*
* Estimates for jobs in energy eciency and grid enhancement are not available for 2016.
** The jobs in grid enhancement (or back up power) are created in the development, operation and maintenance of infrastructure to add more flexibility to the grid
*** Includes all jobs the fossil fuel industry including in their extraction, processing and consumption
OCCUPATIONAL REQUIREMENTS
Depending on the technology, jobs will be distributed along different segments of the value
chain. The chain includes equipment manufacturing, construction and installation, operation
and maintenance, and (in the case of bioenergy) fuel supply. A detailed understanding of the
occupational requirements of renewable energy technologies is required to plan for changes in
the demand for skills during the transition. IRENA’s reports on Leveraging Local Capacity have
analysed the types and number of workers that will be needed in the solar PV and onshore and
offshore wind industries (IRENA, 2018d, 2017f, 2017g). Building on these reports, it has estimated
how many workers in different occupational groups will be required in 2030 and 2050 to achieve
the Energy transition.
Renewables create jobs with a wide range of occupational and skills requirements. Around two-
thirds of the jobs fall into the category of ‘workers and technicians’. Another 16% are ‘experts’ (who
broadly require tertiary education), and 14% are ‘engineers and higher degrees’ (requiring post-
graduate qualifications). The remaining 3% are ‘marketing and administrative personnel’.
As indicated, jobs in some traditional energy sectors will be lost as the transition to sustainable
energy unfolds. With adequate re-training and other transition assistance, a proportion of this
workforce can be absorbed by the renewable energy and energy efficiency sector, helping to meet
the demand for skills. A deeper analysis of the occupational requirements of renewable energy
technologies reveals that the managerial and technical skills and competencies of the oil and gas
workforce are valued in the renewable energy sector. Workers and technicians with expertise in
Figure 22. The energy transition would generate over 11 million additional energy sector jobs
by 2050
Employment in the overall energy sector, 2016, 2030 and 2050 (million jobs)
* Estimates for jobs in energy efficiency and grid enhancement are not available for 2016.
** The jobs in grid enhancement make reference to the jobs for T&D grids and Energy Flexibility, created in the
development, operation and maintenance of infrastructure to enable the integration of RES into the grid.
*** Includes all jobs in the fossil fuel industry including in their extraction, processing and consumption.
SOCIO-ECONOMIC BENEFITS
52
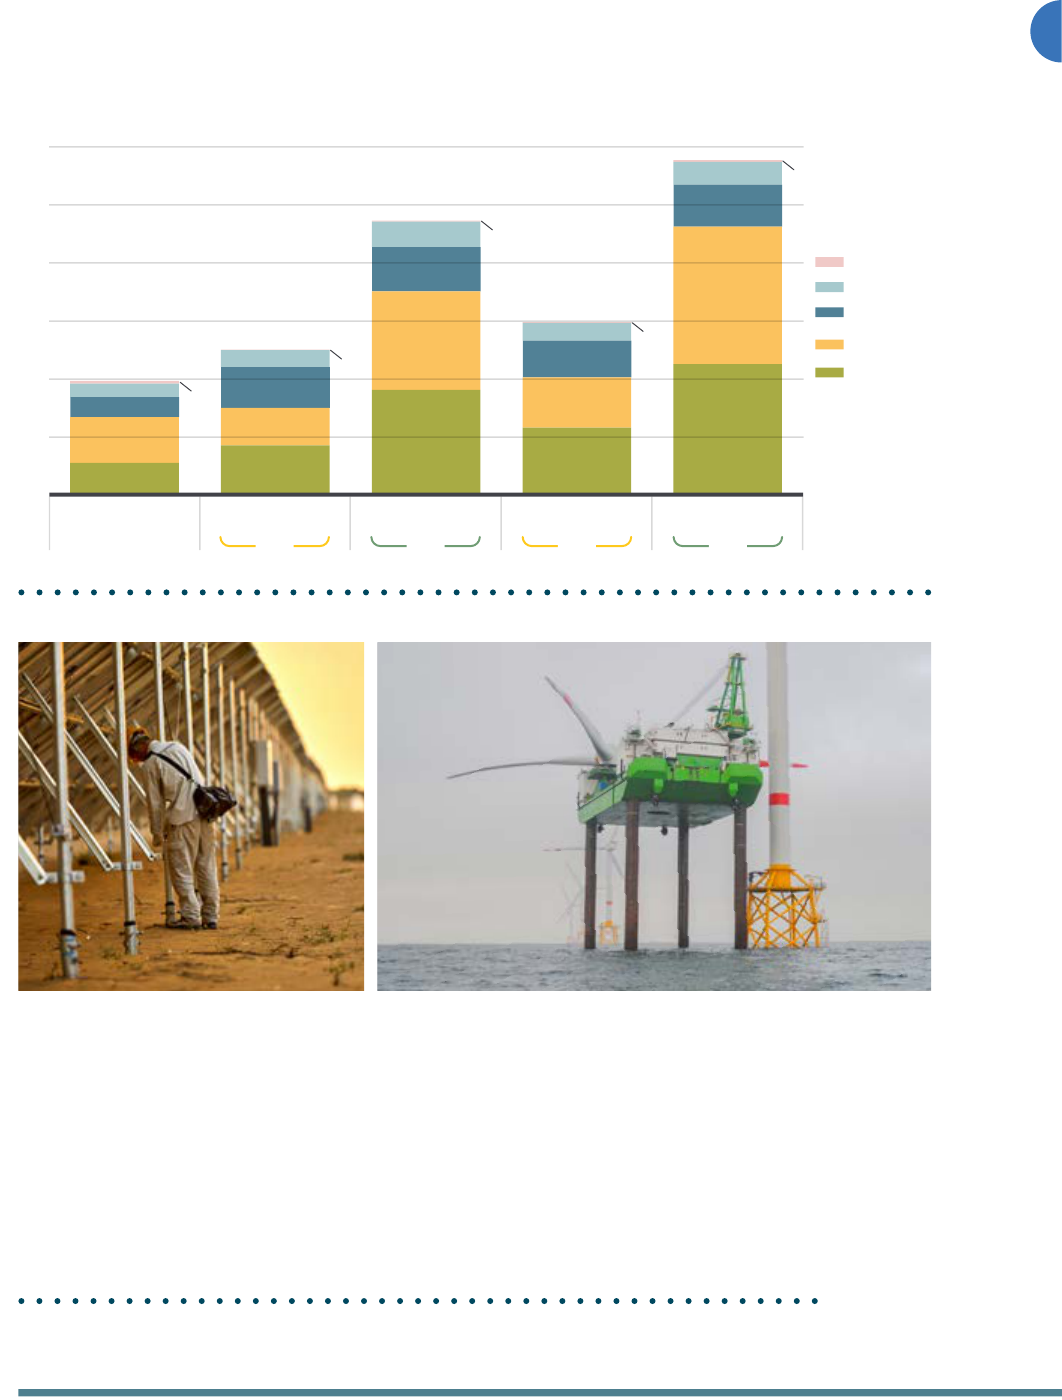
Million jobs
0.22
2.78
3.95
1.73
1.16
0.05
0.10
0.06
0.13
4.29
3.23
3.51
1.46
9.07
8.48
3.81
2.19
5.83
4.33
3.15
1.53
11.28
11.85
3.61
1.97
9.83
12.54
23.65
14.90
28.84
2030
REmap
Case
2030
Reference
Case
2050
REmap
Case
2050
Reference
Case
2016 - Estimate
Others
Wind
Hydro
Solar
(incl. SWH)
Bioenergy
0
5
10
15
20
25
30
EMPLOYMENT IN THE GLOBAL ECONOMY
SOCIO-ECONOMIC BENEFITS
constructing support structures for offshore oil and gas sites, for instance, can help to construct
foundations and substations for offshore wind turbines. Similarly, large scale solar PV can benefit
from the skills of engineers and experts with experience of setting up traditional power plants.
However, energy related jobs are not likely to be created and lost in the same areas and at the
same time. Although the transition offers clear net employment gains, there is also a need for
adjustments as the transition unfolds. This is particularly the case in countries and regions where
many livelihoods depend on the fossil fuel sector. A pro-active just transition policy helps minimise
socio-economic disruptions and promotes economic structures that allow countries to maximise
benefits arising from the transition.
Figure 23. The energy transition would generate 14 million additional jobs in renewable
energy by 2050
Renewable energy employment by technology (million jobs)
53

S
p
e
n
d
i
n
g
o
n
e
d
u
c
a
t
i
o
n
H
e
a
l
t
h
i
m
p
a
c
t
s
f
r
o
m
l
o
c
a
l
a
i
r
p
o
l
l
u
t
i
o
n
G
r
e
e
n
h
o
u
s
e
g
a
s
e
m
i
s
s
i
o
n
s
M
a
t
e
r
i
a
l
c
o
n
s
u
m
p
t
i
o
n
C
o
n
s
u
m
p
t
i
o
n
a
n
d
i
n
v
e
s
t
m
e
n
t
E
m
p
l
o
y
m
e
n
t
WELFARE
E
c
o
n
o
m
i
c
w
e
l
f
a
r
e
E
n
v
i
r
o
n
m
e
n
t
a
l
w
e
l
f
a
r
e
S
o
c
i
a
l
w
e
l
f
a
r
e
GLOBAL WELFARE
The energy transition generates broader socio-economic benefits, in addition to higher
GDP and employment. GDP fails to capture human well-being, which includes health,
education and the environment. As a result, focusing only on GDP may hamper movement
towards truly sustainable and inclusive development. The welfare indicator in this analysis
adopts the widely accepted three dimensions of sustainable development: economic, social
and environmental (IRENA, 2016).
The economic dimension is measured by total employment and by consumption plus investment
(i.e., current expenditure plus the future benefits of improved capital stock). The social dimension
is a proxy for human capital, considers total (public and private) expenditure in education, and
(reduction of) health impacts from air pollution. The environmental dimension focuses on
(reduction of) GHG emissions and the depletion of natural resources through consumption of
materials (measured in direct material consumption of minerals and biomass for food and feed,
excluding fossil fuel energy resources).
This analysis obtains six sub-indicators, two for each dimension of sustainability (see Figure 24)
which are aggregated into an overall welfare indicator. The weighting of each sub-indicator should
ideally depend on the relative importance that a society gives to each, but for this analysis we
weighted all sub-indicators equally.
SOCIO-ECONOMIC BENEFITS
Figure 24. Components of the welfare indicator used in this analysis
Source: Based on IRENA, 2016
54
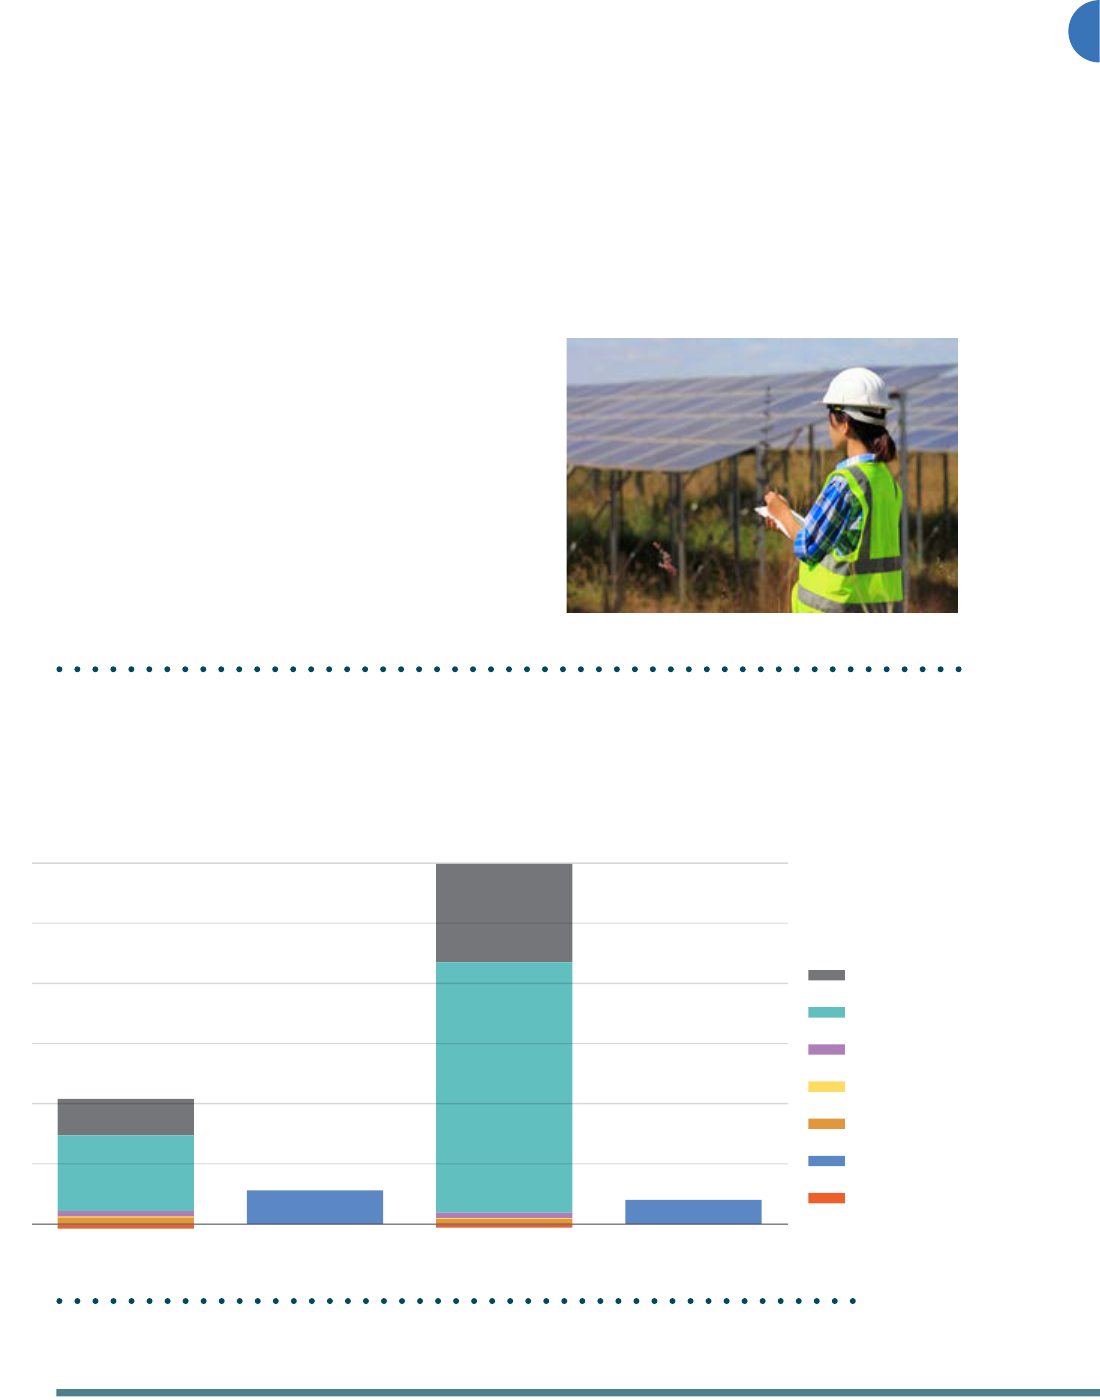
% change compared to the Reference Case
0
5
10
15
Material
consumption
GHG
emissions
Health
Education
Employment
Consumption
and investment
GDP
GDP (2050)Welfare (2050)GDP (2030)Welfare (2030)
GLOBAL WELFARE
SOCIO-ECONOMIC BENEFITS
The transition outlined by REmap improves human well-being in ways that GDP is not able
to capture, and thus the increases in welfare are larger than those in GDP. Figure 25 directly
compares the global welfare indicator (and the contribution from each of its sub-indicators), with
the relative increase in GDP, for the REmap transition in years 2030 and 2050.
Global welfare in 2050 in the REmap Case increases by 15%, compared to a 0.9% rise in GDP
(both measured against the Reference case). This is mainly because of the important reduction in
negative health effects from local air pollution (- 62%) and because of the reductions in greenhouse
gas emissions (-25%, in cumulative terms).
By 2030, global welfare improves 5%, a significantly lower value than the 15% in 2050. This is
because social and environmental improvements (mainly thanks to reductions in health impacts
and greenhouse gas emissions) become more relevant in the longer term, where the change in the
global energy system becomes much deeper.
Therefore, we can see how the difference between welfare
and GDP improvements increases with time. The GDP
improvement is a dynamic response to the initial investment
stimulus which for the REmap roadmap reaches a peak and
then declines within the period up to 2050. On the other
hand, some of the welfare dimensions take more time until
they reach their maximum benefit (local pollution), and other
welfare dimensions (GHG emissions) keep on continuously
improving throughout time as the benefits accumulate year
after year.
Figure 25. The energy transition generates significant increases in global welfare
Welfare indicators and GDP - the REmap Case compared to the Reference Case,
2030-2050, global (%)
55

Importantly, all countries and regions see improvements in welfare, even the ones that experience
GDP reductions (relative to the reference scenario). This sends a clear message to policymakers:
even if GDP improvements in some regions may be slightly lower than in the Reference Case as a
consequence of the energy transition, the health and environmental benefits are of such magnitude
that welfare is positive in all regions.
Under the REmap Case, the social dimension improves 32% globally by 2050. The single most
important welfare benefit of the energy transition is the reduced harm to health from air pollution.
Energy use in cities is much more efficient and clean. Education expenditure is included in the
analysis to represent the wider impacts of the energy transition on human capital (Lange et al.,
2018). Impacts on this sub-indicator are of the same order of magnitude as GDP impacts (a few
percentage points at most). The analysis here, however, has limitations in reflecting the long-
term economic benefits of improved education that could be driven by achieving the Sustainable
Development Goals, in particular that of energy access.
The environmental dimension contributes a 12% improvement in welfare, through greenhouse gas
emissions (25% improvement) and materials consumption (which, interestingly shows a negative
impact of 0.8%). Global cumulative (2018-2050) greenhouse gas emissions are substantially lower
(25%) in the REmap Case (a global 44% reduction in 2050). The largest reductions take place in India
and South Africa, followed by the rest of East Asia and Oceania. Materials consumption (excluding
fossil fuels) increases in the REmap Case, since the improvement in GDP over the reference scenario
is driven by increased consumption, worsening the materials consumption sub-indicator.
Lastly, the economic dimension (0.7% improvement) is evaluated in terms of consumption plus
investment (1.2%) and employment (0.1%). Consumption is often used alone as a welfare measure.
However, this ignores improvements in capital that contribute to future consumption, so the sub-
indicator adds both household consumption and economy-wide investment (i.e., capital formation).
Total employment was also discussed in the previous sections.
SOCIO-ECONOMIC BENEFITS
56
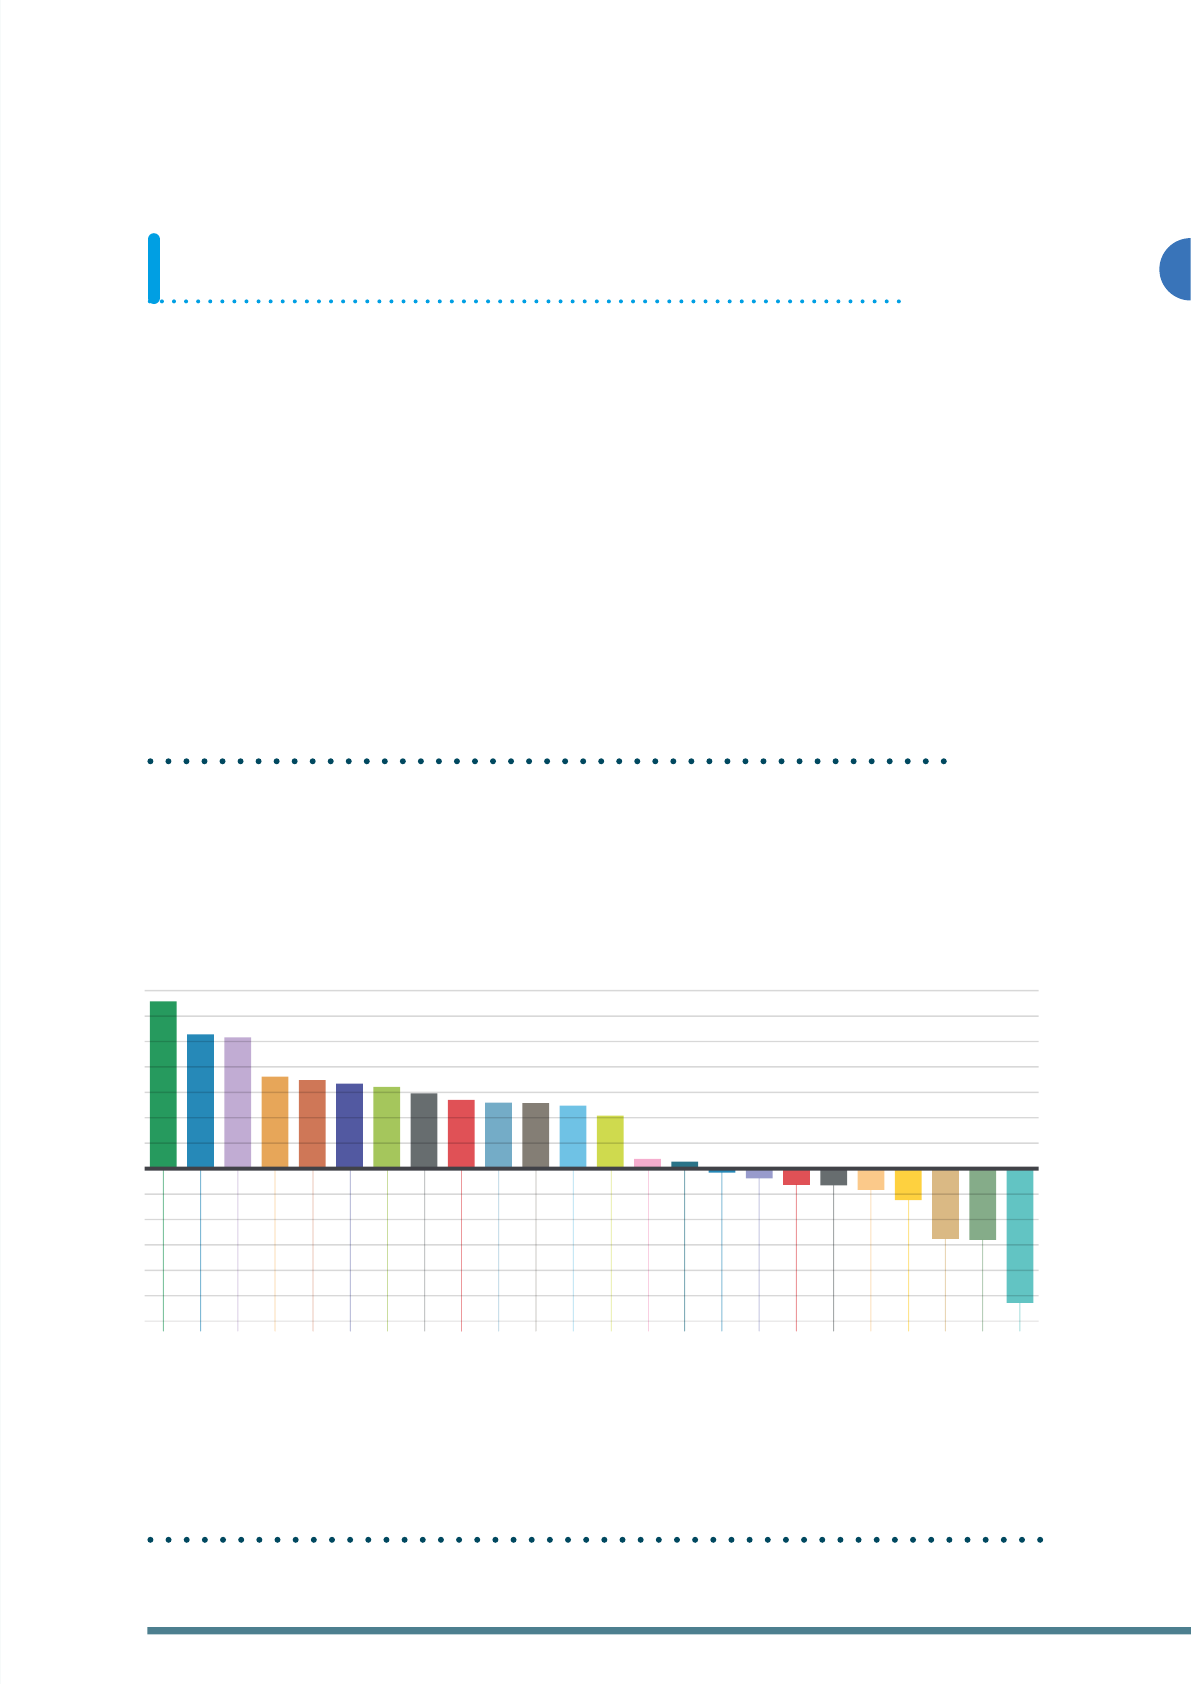
GLOBAL WELFARE
SOCIO-ECONOMIC BENEFITS
REGIONAL GDP, EMPLOYMENT, WELFARE
In absolute terms all regions experience GDP growth. However, the socio-economic benefits of the
energy transition are not evenly distributed. This is because the various drivers play out differently
across countries and regions, depending upon their energy systems, ambition of the energy
transition, and socio-economic characteristics.
Figure 26, Figure 27 and Figure 28 present the change in GDP, employment and welfare of the
REmap transition over the Reference Case in 2050 for different regions, countries and groups of
countries.
It is important to emphasise that all countries and regions see improvements of welfare, even those
that experience less growth of GDP than they would under the reference scenario (Figure 26 and
Figure 27). Furthermore, across all regions welfare improvements are significantly higher than GDP
gains, reflecting the high positive impact of the transition on the social and environmental welfare
dimensions, which the GDP does not manage to capture. Yet certain transition challenges need to
be addressed to ensure that all regions benefit from the energy transition (see Box 3).
Figure 26. Impact of the energy transition on GDP
GDP impacts in select regions & countries - the REmap Case compared to the
Reference Case, 2050 (%)
-3.0
-2.5
-2.0
-1.5
-1.0
-0.5
0.0
0.5
1.0
1.5
2.0
2.5
3.0
3.5
% dierence in GDP from Reference Case
Russian Federation
Africa OPEC
rest of Africa
Middle East
India
Net Oil Exporter
Canada
Southeast Asia
Argentina
Eastern Europe
Oceania
Brazil
G20
Coal-dependent
Northern Europe
China
Net Oil Importer
Mexico
United States
rest of Latin America
Southern Europe
rest of East Asia
Western Europe
South Africa
57

Figure 27. Impact of the energy transition on welfare
Welfare impacts in select regions & countries - the REmap Case compared to the
Reference Case, 2050 (%)
Figure 28. Impact of the energy transition on employment
Employment impacts in select regions & countries - the REmap Case compared to
the Reference Case, 2050 (%)
0
5
10
15
20
Russian Federation
Africa OPEC
rest of Africa
Middle East
India
Net Oil Exporter
Canada
Southeast Asia
Argentina
Eastern Europe
Oceania
Brazil
G20
Coal-dependent
Northern Europe
China
Net Oil Importer
Mexico
United States
rest of Latin America
Southern Europe
rest of East Asia
Western Europe
South Africa
% dierence in welfare from Reference Case
-0.6
-0.3
0.0
0.3
0.6
0.9
1.2
1.5
Russian Federation
Africa OPEC
rest of Africa
Middle East
India
Net Oil Exporter
Canada
Southeast Asia
Argentina
Eastern Europe
Oceania
Brazil
G20
Coal-dependent
Northern Europe
China
Net Oil Importer
Mexico
United States
rest of Latin America
Southern Europe
rest of East Asia
Western Europe
South Africa
% dierence in employment from Reference Case
SOCIO-ECONOMIC BENEFITS
58

REGIONAL GDP, EMPLOYMENT, WELFARE
Figure 28. Impact of the energy transition on employment
Employment impacts in select regions & countries - the REmap Case compared to
the Reference Case, 2050 (%)
SOCIO-ECONOMIC BENEFITS
As is the case for the world economy as a whole, the GDP, employment and welfare results across
different regions are shaped by the key drivers. Some key findings are discussed below.
GDP
While the energy transition increases global GDP by 2050 by about 1% (relative to the Reference
Case), many economies will fare better and some worse. In general terms, the GDP of countries
that depend on fossil fuel revenues could experience a hit as demand decreases, in particular, the
Middle-East, the rest of Africa, Africa OPEC and the Russian Federation (see Box 3). The effects in
specific regions of some of the main macroeconomic drivers are discussed below.
n
Investment. Investment plays a key role in many countries and regions, and in most cases has a
positive impact. Under the REmap Case, increased investment raises the GDP of most countries
and regions. The positive effect peaks around 2030, after which it gradually declines until
2050. Investment particularly benefits the rest of Latin America and Middle East regions. Brazil
is projected to face the biggest loss in GDP growth because it will experience high foregone
investment in the rest of the economy (mainly upstream fossil fuel supply and crowding out).
Oceania, Net Oil Exporters and the Russian Federation also face marginally negative effects of
investment.
n
Trade. Trade causes small positive impacts in many regions and negative impacts in a few. It
has a marginally positive role in the G20, oil importing countries, coal dependent countries, and
Southeast Asia. Countries such as Brazil and South Africa experience a positive impact in both
2030 and 2050 due to a sharp decrease in imports of fossil fuel and an increase in consumption
of domestic goods and services. The rest of Latin America region is negatively influenced by
trade throughout the transition period, primarily due to shifts in prices and increased imports of
consumer goods and services.
n
Tax rate. Changes in tax rates have a negative impact only in Africa OPEC, India and Southeast
Asia, in both short (2030) and long term (2050). In Africa OPEC and Southeast Asia this is mainly
driven by the fall in fossil fuel revenues (which increases income tax for consumers). The case
of India is different. There, the negative impact arises because the government benefits from
the phase-out of fossil fuel subsidies more in the Reference Case than the Transition Case. The
Middle-East and Oceania enjoy the biggest benefits from changes in the tax rate driver because
they save more on energy subsidies in these regions.
n
Indirect and induced effects. In the long run, indirect and induced effects play the biggest
role in driving GDP growth in many regions of the world. This effect is stronger in regions and
countries that redirect their consumption to the domestic supply chain during the energy
transition. South Africa enjoys the biggest benefit from this driver partly for this reason, and
partly because inflation falls. Given existing economic structures, the Middle East, Rest of Africa,
the Russian Federation and to a lesser extent Africa OPEC are particularly affected by the impact
of this driver on GDP.
59

WELFARE
The greatest overall improvement in welfare (19% or more) is found in Mexico, followed by Brazil,
India and Oceania. These are countries and regions in which the impact of pollution on health
falls sharply. The transition also generates high welfare improvements in other regions/countries,
including the rest of East Asia, South Africa, Southern Europe and Western Europe. Even regions
that derive smaller welfare improvements gain significantly (above 8%). All countries gain similar
levels of environmental benefit because this dimension is dominated by reduced GHG emissions,
for which a single global value was used.
EMPLOYMENT
Under the REmap Case, the regional net gain in employment (relative to the Reference Case)
fluctuates over time. Even so, the energy transition has a positive impact on almost all regions and
countries. Some developing countries, mostly located in Africa (and in parts of Asia) experience
negative impacts because the benefits of transition are not distributed fairly within the socio-
economic structure. Reforms are required to correct this effect. Some of the main employment
impacts in specific regions are discussed below.
n
Investment. Although investment kickstarts the employment benefits generated by the
transition, over the whole period it plays a less significant role in many regions and countries than
other drivers. Southeast Asia and South Africa benefit the most from increased investment in the
long term, while by 2050 investment is a significant drag on employment in India.
n
Trade. Turkey and India experience relatively significant positive trade impacts by 2050. Most
regions, however, face impacts that are either relatively small or negative. Southeast Asia and
the Rest of Africa regions face the most adverse impacts in 2050. In Southeast Asia, this is due to
the negative impact of changes in non-energy trade; changes in fossil fuels trade have a marginal
impact. In Indonesia, however, trade causes only a slight negative drag on employment by 2050,
because the fossil fuels trade has a strong negative impact but this is balanced by the significant
positive impact of non-energy trade. For the rest of Africa, trade in fuels produces a strong
negative impact that the region only partially attenuates by marginally improving non-energy
trade.
n
Consumer expenditure. Brazil, the rest of East Asia, all of Europe and South Africa benefit the
most from consumer expenditure. All these regions and countries have in common a consumer-
focused economy with strong supply chains in the local economy. On the other hand, consumer
expenditure negatively affects African OPEC members and countries in the rest of Africa
grouping. This is again because they lose revenues and employment in the fossil fuel sector and
increasingly rely on imports because local supply chains are weaker. In the rest of Africa, there
is a very significant positive spike in consumer expenditure in the first half of the transition,
associated with the creation of new jobs and significant additional investment. This suggests
that an ambitious energy transition would increase benefits to the region, but also that the
absence of adequate and stable policies would reverse this dynamic. In this case, consumer
expenditure would inhibit job creation.
SOCIO-ECONOMIC BENEFITS
60

SOCIO-ECONOMIC BENEFITS
Box 3
Addressing fossil fuel export dependency and other transition challenges
Figure 26 clearly shows that in GDP terms the REmap transition roadmap has some countries and
regions emerge as winners, relative to the Reference Case, while others are losers. However, this
is not an unavoidable outcome of the transition, but rather the consequence of imperfections in
the transition path and/or socio-economic system. The outcome can be improved by addressing
the underlying structural dimensions.
Dependency of an economy from fossil fuel exports is one of the main structural elements
leading to a deterioration of GDP relative to the Reference Case, because the transition entails
a reduction in fossil fuels demand and hence a reduction of the exports from these economies.
The position of each country in the fossil fuel supply-cost curve determines how strong this
negative impact will be. This contributes to explain the relatively poor performance of rest of
Africa, since many of the countries within this region are oil exporters positioned in the high
end of the supply-cost curve. The entailment of the domestic supply chains with the fossil fuel
industry also contributes to determine the final impact from this element, which contributes to
explain the poor GDP performance in the Russian Federation. Addressing this structural element
requires anticipating to the situation forecasted by the macroeconomic model by actively
diversifying the economy and reducing its dependency from fossil fuel exports. In many cases,
this involves addressing regional just transition considerations, since big parts of the society
from these countries is currently held hostage by the fossil fuel industry that has benefited the
growth of the economy elsewhere.
A low regional ambition of the transition is another structural element that can lead to an
underperformance relative to the Reference Case. In the rest of Africa, the relatively low transition
investments are soon offset by the foregone fossil fuel investments, dragging the economy.
The investment stimulus associated to increasing the transition ambition beyond past trends
in low-income countries, would lead to GDP and employment increases over the Reference
Case, facilitating that these countries participate from the benefits of the transition. Moreover,
comparatively increasing the transition ambition in low-income countries is closely related to
fair transition considerations, since these countries have the lowest historic responsibility on the
current climate crisis because of using a fraction of the historic carbon budget well below their
fair share.
Weak domestic supply chains also contribute to the underperformance relative to the Reference
Case, which is another of the drivers of the poor transition performance obtained for rest of
Africa. In the absence of strong and deep domestic supply chains an economy cannot reap all
the benefits from the energy transition investment stimulus, with other countries benefiting
from its direct and indirect effects. Moreover, in the absence of deep domestic supply chains,
an economy does not benefit from the induced effects driving the GDP and employment
improvements in the long term, experiencing negative trade impacts by seeing its import
dependency increase even in non-energy products.
A priority investment programme, funded by international climate finance, addressed
to increase the transition ambition and reinforce domestic supply chains in low-income
countries would contribute to overcome these structural barriers.
61

HOW FINANCE AFFECTS THE ENERGY TRANSITION
Finance is a cornerstone of the energy transition. To achieve the transition, investment
must increase significantly beyond the level expected under current and planned policies. The
investment trend in renewables has been positive: it increased eightfold between 2004 and
2017, when it was valued at USD 280 billion (Frankfurt School-UNEP Centre and BNEF, 2018).
Significant additional growth is nevertheless needed. In 2016, about three quarters of all the
investment in renewable energy occurred in China, Western Europe and OECD America, and
about 90% of that investment came from private sources in those countries (IRENA & CPI, 2018).
In other regions, public finance accounted for a much larger proportion of direct renewable
energy investment: 41% in Sub-Saharan Africa, 49% in Latin America and the Caribbean, and
24% in South Asia.
The lack of effective transition until now is likely to lead to significant investment requirements for
climate change adaption, and further delays will decrease the available time window for deployment
of capital within a specific climate goal, increasing the required investment rate, which in turn
introduces additional pressures in the financing system. In this analysis, two elements associated
with potential investment restrictions (cost of capital and crowding out) have been assessed, and
their quantitative impacts on the transition’s socioeconomic footprint have been estimated.
First is the cost of capital and its link to higher levels of debt. The cost of capital varies across
projects, industries and countries, and is based on many factors which ultimately boil down to
the level of risk that lenders perceive. One risk factor is the indebtedness of the stakeholders that
implement the energy transition, with the assumption that such indebtedness would grow in a
context of increasing financing requirements. Despite the effect of higher debt ratios on the cost
of capital, and its associated impact on final energy prices, the REmap Case still generates more
benefits than the Reference Case. In addition, the analysis found that more expensive capital has a
relatively marginal impact, though it lowers increases in both GDP and employment. The negative
effect of more expensive capital also increases over time; it is modest until 2030 but becomes
substantial by 2050.
With rising levels of ambition, higher cost of capital could have significant impacts on the transition
unless appropriate polices are put in place to address this issue. Moreover, those countries and
regions which already face high borrowing costs due to certain country-specific risks may face
an even greater challenge. Finally, since currently available information on the cost of capital to
finance the transition is very scarce, close monitoring is needed so that policymakers can anticipate
emerging barriers.
The second element is the crowding out of capital due to additional investment requirements.
This will occur, for example, if the additional capital needed to finance the energy transition is taken
from other sectors of the economy. The report’s macroeconomic analysis assumes that 50% of
net additional investment is crowded out from other sectors. Since this effect is subject to high
uncertainty, the goal was to identify the factors that drive crowding out and evaluate how they and
any crowding out they cause can be distributed throughout the world economy during the energy
transition.
Empirical evidence supports the post-Keynesian view of money supply which posits that commercial
banks (rather than the central bank) create money, within macroeconomic conditions and reserve
requirements, whenever they hand out new loans and create matching deposits (Campiglio, 2016;
Pollitt and Mercure, 2018). Within this framework, there is no crowding out of investment in one
sector as a result of higher investment in another sector. However, there are differences between
SOCIO-ECONOMIC BENEFITS
62

HOW FINANCE AFFECTS THE ENERGY TRANSITION
SOCIO-ECONOMIC BENEFITS
countries in the extent to which money can be created, because policymakers use a variety of tools
and in varying degrees to foster financial and economic stability. While in many developed countries,
the mandate of central banks is fairly limited to maintaining price stability (inflation targeting) by
setting the base rate (interest rate at which central bank lends money to commercial banks), in
the emerging and developing countries, central banks and other financial authorities exhibit a
higher degree of control on the dynamics of credit growth, as they deploy a wider range of policy
tools, such as reserve requirements and macroprudential policies, to safeguard financial stability in
addition to price stability (based on review of Akinci and Olmstead-Rumsey, 2018; Campiglio, 2016;
Cerutti et al., 2017; Zhang and Zoli, 2014).
As well, there is a clear difference between banks and non-bank private investors, as the
non-bank private investors largely operate by reallocating the existing stock of credit, whereas
commercial banks can also allocate new money, and thus create new money (Campiglio, 2016).
This element also points to a potentially higher risk of crowding out in those regions which are less
reliant on private sector capital (and therefore more reliant on public sources of capital) to finance
the energy transition. As mentioned earlier, less developed countries are currently more reliant on
public finance to finance renewable power compared to more advanced economies. Therefore,
although the currently assumed 50% crowding out is highly likely a very conservative assumption
for the global economy in the current context, important regional variations of crowding out should
be expected, with a higher crowding out in poorer regions, contributing to an increasing inequality
along the energy transition.
To quantify the macroeconomic impact of crowding out, a sensitivity analysis tested two extreme
cases, of 0% and 100% crowding out. In the first extreme case (100% crowded out), the REmap
Case generates better GDP and employment outcomes than the Reference Case, but there is a
very significant impact on both (the employment impacts are shown in Figure 29). In the opposite
scenario (no crowding out), changes in both GDP and employment are about twice as high in
most years than under a midway scenario (50% crowding out). Changes of GDP and employment
are lower under the 100% scenario than they are under the 50% scenario, but the deterioration is
relatively less pronounced than under the 0% relative to 50% scenario.
63
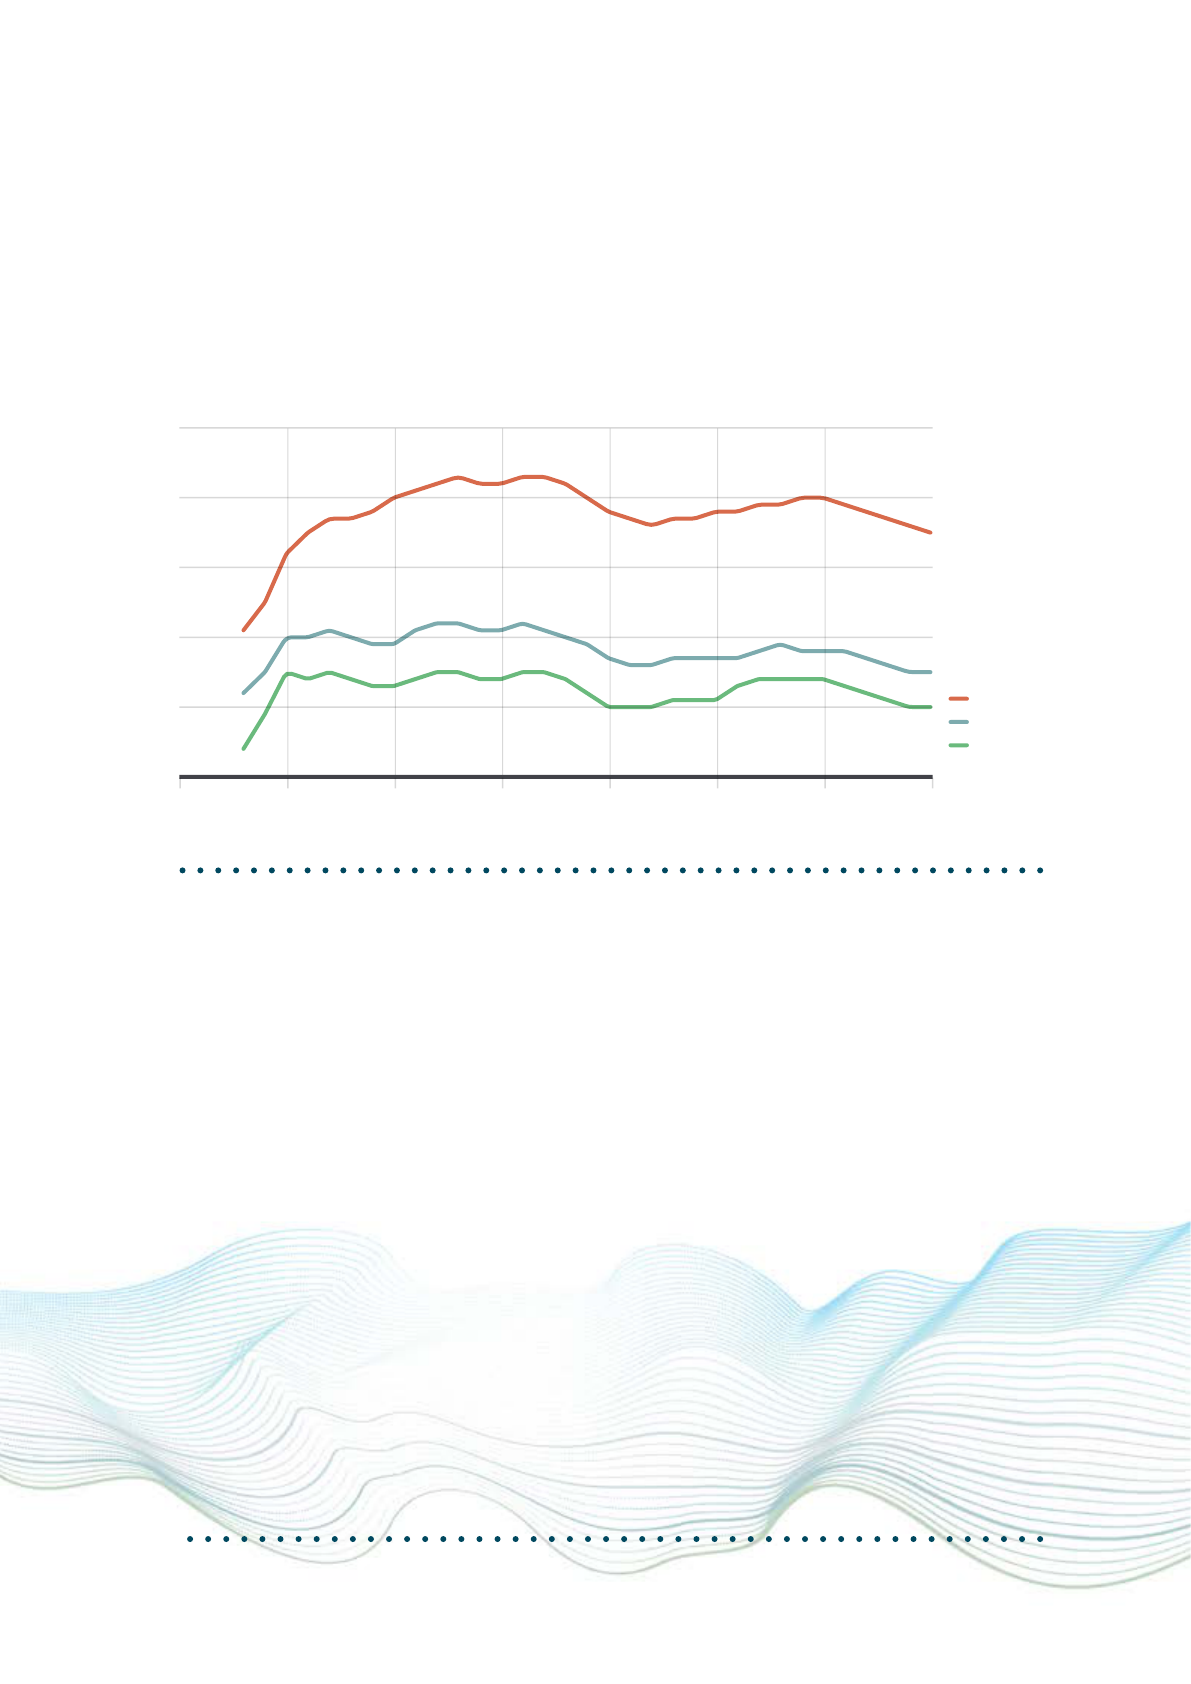
0.0
0.1
0.2
0.3
0.4
0.5
2015 2020 2025 2030 2035 2040 2045 2050
Partial crowding out (50%)
No crowding out (0%)
Full crowding out (100%)
% dierence in employment from Reference Case
Figure 29. Crowding out of capital does affect employment, but the energy transition still
generates positive employment growth
Relative increment of employment for dierent crowding-out assumptions -
the REmap Case relative to the Reference Case, global (%)
SOCIO-ECONOMIC BENEFITS
Policy measures and structural socioeconomic modifications can limit the extent of crowding
out without compromising financial stability. Realigning economic flows during the transition
(for example, by means of carbon taxes and phasing out fossil fuels subsidies) can generate new
sources of capital.
Unlocking new sources of capital, for example from institutional investors or
socially driven and community-based finance, can help reduce crowding out effects in the economy.
Finally, even where crowding out occurs, policies and regulations can direct the crowding out effect
to make sure that it does not hurt socially sensitive sectors.
64

KEY SOCIO-ECONOMIC MESSAGES
KEY SOCIO-ECONOMIC MESSAGES
Understanding the socioeconomic footprint from the energy
transition is fundamental:
n
The energy transition cannot be considered in isolation from the associated socio-economic
system. The interactions between both determine the overall transition outcome. Favouring the
synergies between them offers the potential to maximise the benefits from the transition.
n
While this analysis has focused on a particular scenario, transition pathways may vary, as does
the transformation of the socio-economic system itself. Irrespective of the particular path chosen
by policymakers, the socioeconomic footprint of the overall transition provides an adequate
means to measure its performance.
n
The REmap energy transition significantly improves the global socioeconomic footprint over
the reference scenario, providing in year 2050 global increases of 15% in welfare, 1% in GDP and
0.1% in employment.
n
The socioeconomic benefits from the transition (welfare) go well beyond GDP improvements,
and are strongly dominated by social and environmental benefits (reduction of local air pollution
and reduced climate impacts due to reduced GHG emissions)
n
At regional level the outcome of the REmap energy transition depends on the combination of
its regional ambition and the regional socioeconomic structure. Significantly different regional
socioeconomic footprints are obtained from the REmap energy transition, with clear winners
and losers, and increasing inequalities that could eventually develop in transition barriers.
n
Regions with socioeconomic systems dependent of oil exports or weak socioeconomic structures,
can see GDP and employment reductions relative to the Reference Case, though still they will
experiment a significant welfare improvement.
n
The capability of a region to reap the long lasting indirect and induced transition benefits depends
on how much its domestic supply chains contribute to the energy transition deployment and to
the induced economic activity.
n
Maximising the socioeconomic benefits of the energy transition requires increasing the transition
ambition, internalising climate externalities (carbon taxes, fossil fuel subsidies phase-out), and
stimulating the diversification and reinforcement of deep domestic supply chains.
SOCIO-ECONOMIC BENEFITS
65

The energy sector benefits from the energy transition but holistic
employment policy is required:
n
Within the energy sector, more jobs are created by the transition than those lost in the fossil
fuel industry. The REmap energy transition would lead to a loss of 7.4 million jobs in fossil fuels
by 2050, while a total of 19.0 million new jobs could be created in renewable energy, energy
efficiency, and grid enhancement. The net change is a gain of 11.6 million jobs.
n
The global renewable energy workforce could rise from just 9.8 million in 2016 to around 23.7
million in 2030 and 28.8 million in 2050 following an accelerated ramp up in deployment of
renewables in line with the REmap roadmap.
n
To meet the human resource requirements of a rapidly expanding renewable energy and energy
efficiency sectors, education and training policies would need to consider and plan for the
skills needs of these sectors, minimising the import of foreign labour and maximising local value
creation.
n
The geographic distribution of energy sector jobs gained and lost are unlikely to be aligned.
This could introduce challenges for maintaining employment among fossil fuel workers if the
focus is only put on retraining within the energy sector. Induced and indirect jobs created by the
transition in other parts of the economy dominate the transition employment creation (especially
with low crowding out) and are more homogenously distributed than direct energy-related jobs.
Additional measures such as social protection programmes and adequate transition support are
critical.
Improving the transition’s socioeconomic footprint:
n
Modifying the socioeconomic structure incorporating fair and just transition elements improves
the socioeconomic footprint and prevents barriers that could ultimately halt the transition. The
transition of the socioeconomic system itself offers a high potential for maximising the benefits
from the overall transition.
n
The socioeconomic footprint can be substantially improved by increasing the energy transition
ambition in alignment with the climate requirements and by addressing regional issues, aiming at
a 100% RES share before 2050, in line with the available carbon budget to limit warming within
1.5°C.
n
Negative impacts on low-income countries must be addressed for the transition to be successful.
Increasing the energy transition ambition and prioritising climate finance to steer the transition in
these countries, reinforcing domestic supply chains to reap indirect and induced effects from the
transition, and redirecting global economic flows with fairness criteria (i.e. regional redistribution
of carbon tax incomes), can all contribute to address these issues.
SOCIO-ECONOMIC BENEFITS
66

KEY SOCIO-ECONOMIC MESSAGES
The role of finance as a transition cornerstone:
n
Financial constraints can act as brakes to the mobilisation of finance required to deliver the
energy transition – furthermore, their impact can be expected to increase over time and they
may affect the already disadvantaged regions especially harshly.
n
Act fast. Climate boundaries require a fast scale-up of investment in renewable energy and
energy efficiency in a relatively short time window. As well, the further we delay the scale-up
in investment, the higher will be the cost of capital needed to finance the transition. Therefore,
fast action is needed to lower this potentially significant transition barrier and to ensure that the
benefits of moving towards cleaner and more modern energy sources are no longer delayed.
n
The financial system should be aligned with broader sustainability and energy transition
requirements.
n
Crowding out has an important impact in the GDP and employment improvements over the
Reference Case: reducing crowding out from 50% to 0% produces an improvement of 60%
in GDP and of 100% in employment. Although the assumed 50% crowding out seems a very
conservative assumption for the global economy in the current context, important regional
variations of crowding out should currently be expected, with the higher crowding out in poorer
regions, contributing to the increasing inequality along the energy transition.
n
Policy measures and structural socioeconomic modifications could limit the amount of
effective crowding out, even without compromising regional financial stability. One example
would be realigning transition economic flows (carbon taxes, fossil fuels subsidies phase-out)
with regional redistribution criteria addressing fair transition issues. Even in the presence of
crowding out, adequate policies and regulations can properly direct the crowding out effect
making sure that it does not bite from socially sensitive sectors.
n
Underutilised sources of finance should be unlocked. One potential source are institutional
investors (pension funds, insurance companies, endowments and sovereign wealth funds), who
managed about USD 96 trillion in total assets in 2013 in OECD, yet provided less than 1% of the
primary financing of renewable energy in the 2013-2016 period.
n
Another source of capital that should be fostered is community-based finance. This has a
broader range of considerations compared to ‘traditional’ investors, and can help lowering the
overall cost of borrowing for the transition and reduce the risk of undesirable crowding-out, while
simultaneously facilitating the involvement of society in the transition.
n
Scarce public finance should be used to help mitigate key risks and to lower the cost of
capital in countries/regions perceived as high risk. This can also contribute to correct some of
the potentially negative GDP impacts on these countries/regions.
SOCIO-ECONOMIC BENEFITS
67
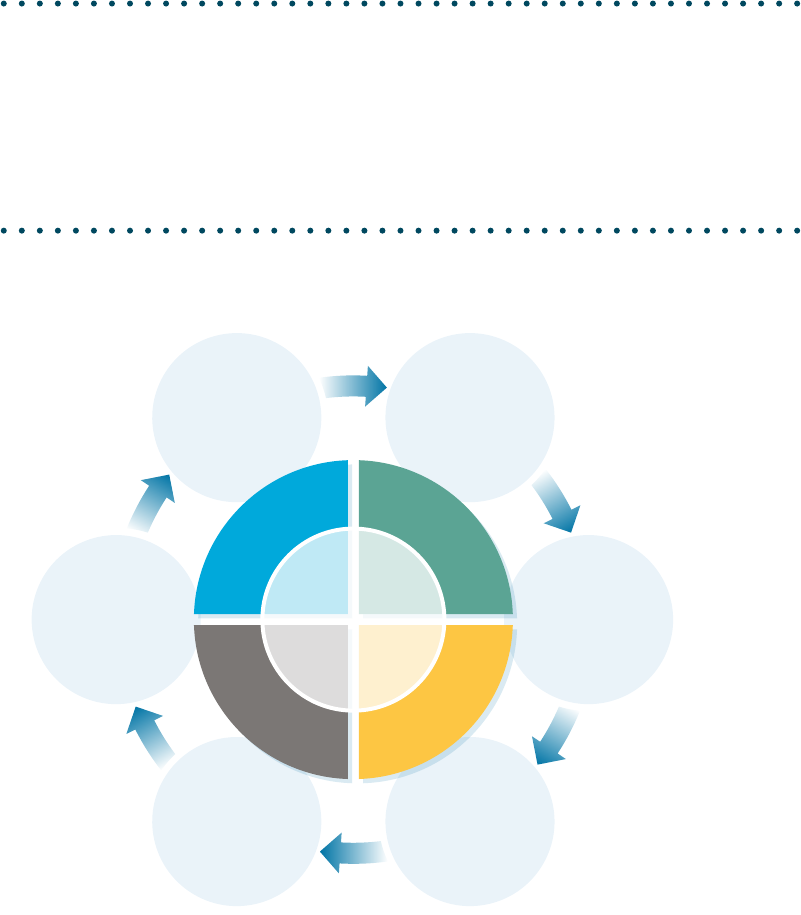
Which sectoral
policies could be
enhanced to
strengthen the
Energy
Transition?
Within the
energy sector,
are policies and
regulations focused
on delivering the
Energy
Transition?
What
improvements in
renewable energy
and energy eciency
can be made in the
energy chain?
What forms of
technology
innovation are
needed?
What
changes in
institutional, business,
and financial behaviour
are needed to facilitate
and accelerate the
Energy
Transition?
Is the Energy
Transition at the
centre of government
policies?
PLANNING FOR
THE GLOBAL ENERGY
TRANSFORMATION
I
n
v
e
s
t
m
e
n
t
s
h
i
f
t
C
o
g
n
i
t
i
v
e
s
h
i
f
t
P
l
a
n
n
i
n
g
s
h
i
f
t
P
o
l
i
c
y
s
h
i
f
t
HOW TO FOSTER THE GLOBAL ENERGY TRANSFORMATION
HOW TO FOSTER THE GLOBAL
ENERGY TRANSFORMATION:
KEY FOCUS AREAS
The challenge that policy makers around the world face is how to accelerate the transition. Fully
delivering the energy transition will require a transformation in how we view and manage the energy
system. Transitioning in a few decades from a global fossil-fuel powered energy system, built-up
over several hundred years, to one that is sustainable, will require a much greater transformation
than current and planned policies (the Reference Case) envisage.
Planning for the energy transition requires
fundamental shifts in policies, investments, planning
processes, attitudes and behaviour.
Figure 30. Planning for the global energy transformation
68

HOW TO FOSTER THE GLOBAL ENERGY TRANSFORMATION
Not only governments should take the lead. To stimulate the innovation process, and shape and
create technologies as well as sectors and markets, new relationships and closer partnerships must
be developed with the private sector. Coordination of the efforts of this network with stakeholders
is vital, using the state’s convening power to build trust and targeted policy instruments to achieve
clear goals. Delivering innovation will require national governments, international actors and the
private sector to act in an intensive, focused and more co-ordinated manner. Action is urgently
required because a full-scale energy transition will take decades to implement due to the different
technologies that must be developed and the long lifespan of existing capital stock.
Facilitating and encouraging behaviour change with respect to energy consumption and the
supply of energy services is a critical element of an accelerated energy transition. Together with
digitalisation, education and regulation help to encourage and support changes in behaviour.
These might encourage the local generation of renewable energy, the adoption of energy
efficiency improvements, recycling and reuse, etc. Businesses will be required to innovate and
adapt to a decarbonised global energy matrix. Utilities will need to review their business models.
All stakeholders will need new management and governance skills to enhance transparency,
accountability and enforcement of clean energy policies. Incentive schemes must be designed to
permit consumers to become net clean energy producers.
The following section sets out some key priorities and practical policy measures that will help
policymakers accelerate the energy transition.
FOCUS AREA 1. TAP INTO THE STRONG SYNERGIES BETWEEN ENERGY
EFFICIENCY AND RENEWABLE ENERGY.
To achieve this objective, government policymakers should:
n
Combine energy efficiency and renewable energy measures (for example, public sector policies
that integrate renewable technologies in the renovation of public buildings).
n
Deploy technologies that promote renewable energy and increase energy efficiency (for example,
combined heat and power (CHP) systems fuelled by renewables to recover waste heat for use by
industrial plants or commercial and residential buildings).
69

HOW TO FOSTER THE GLOBAL ENERGY TRANSFORMATION
FOCUS AREA 2. PLAN A POWER SECTOR FOR WHICH
RENEWABLES PROVIDE A HIGH SHARE OF THE ENERGY
Power systems are changing at a pace that has not been seen since the start of the electric utility
industry over a hundred years ago. Several interconnected policy and operational changes will
need to occur to enable power systems to make extensive use of renewable energy, particularly
sources of variable renewable energy such as photovoltaic solar and wind power. To achieve this
objective, policymakers should:
n
Support investment to enable infrastructure to integrate VRE and smart technologies (including
batteries, smart charging for electric vehicles, blockchain, machine learning, use of “big data”)
that have the potential to optimise extensive use of renewables to generate power.
n
Promote time-responsive power-to-heat, power-to-cool, power-to-hydrogen systems that
heat, cool or produce energy at off-peak or low-price periods or can absorb excess renewable
electricity.
n
Promote innovative business models that enhance the system’s flexibility and incentivise
deployment of renewable technologies. Examples include virtual power plants, innovative forms
of power purchase agreements, platform business models such as peer-to-peer trading, and
business models that enhance demand side response.
FOCUS AREA 3. INCREASE USE OF ELECTRICITY IN TRANSPORT,
BUILDINGS AND INDUSTRY
This will help to unlock substantial efficiency gains and yield a wide range of other benefits, including
the reduction of air pollution in cities. To achieve this objective, policymakers should:
n
Set targets for the replacement of conventional fossil fuel-based technologies by electric vehicles,
heat pump systems, and electrical stoves.
n
Facilitate sector coupling between power and end-use sectors, to facilitate the integration of
variable renewables in the power sector.
n
Increase flexible electricity demand by means of demand side management, smart charging and
vehicle-to-grid for electric vehicles, flexible heat pump heating and cooling, thermal storage fed
by electricity, etc.
n
Use information communication technology and digitalisation, along with demand side management,
to reduce peak electricity demand, lower the need to invest in power capacity, and reduce
operational costs.
70

HOW TO FOSTER THE GLOBAL ENERGY TRANSFORMATION
FOCUS AREA 4. FOSTER SYSTEM-WIDE INNOVATION
Innovation has played a key enabling role in energy transition to date, particularly in solar and
wind technologies. A critical but often underappreciated point is that innovation is far broader
than technology research and development: it must cover a technology’s life cycle, including
demonstration, deployment (technology learning) and commercialisation. Innovation ecosystems
should also cover a wide range of activities, including new approaches to power system operation,
market design, enabling technologies, and business models. Alongside innovative generation
technologies, innovation is needed across the whole energy system to assist the system to integrate
variable renewable energy generation and accelerate the widespread adoption and scale-up of
clean energy.
To accelerate the energy transition Governments should:
n
Support the formation of an Energy Transition Coalition that will bring together countries that
lead the development of long-term energy transition strategies, foster investments in low carbon
energy, and increase investor confidence in low carbon economic growth.
n
Increase public sector investment in research, development and demonstration (RD&D), aligning
with pledges made by Mission Innovation members at the Paris Climate Agreement (COP21).
n
Co-operate with and strengthen international programmes (such as IRENA, the IEA, and its
Technology Collaboration Programmes and Mission Innovation) to define a joint agenda for
renewable technology innovation that will identify the critical innovation needs of developed,
emerging and developing markets and prepare collaborative strategies to meet them.
n
Improve global understanding among key public and private sector actors of critical innovation
needs.
n
Establish more bilateral and multilateral demonstration projects, at commercial scale and funded
publicly or privately, as well as “real-world” pilot programmes to test innovative technologies and
processes.
n
Encourage the development of internationally harmonised technical standards and quality
control standards to facilitate cross-border trade and exchange of innovative technologies.
n
Concentrate RD&D efforts to assist sectors that lack commercially available decarbonisation
solutions. Relevant sectors include energy intensive industries (iron, steel and cement production)
and transport (freight, aviation and shipping).
FOCUS AREA 5. ALIGN SOCIO-ECONOMIC STRUCTURES AND
INVESTMENT WITH THE TRANSITION
The success of the energy transition depends on how well it is connected to efforts to address the
transition of the broader socio-economic system itself. Implementing the energy transition requires
significant investments. More than that, climate boundaries require a rapid scale-up of investment
in renewable energy and energy efficiency within a relatively short time window. The quicker that
the energy transition gets under way, the lower the climate change adaptation costs will be and
the smaller the socio-economic disruption. But the longer the needed scale-up in investment is
delayed, the higher the cost of capital needed to finance the transition. The financial system needs
to be aligned with broader sustainability and energy transition requirements. A timely mobilisation
of investments requires addressing the barriers that conventional financing faces, as well as
mobilising additional investment streams.
71

n
One potential source are institutional investors (pension funds, insurance companies, endowments
and sovereign wealth funds). Another is the growth of new capital market instruments, such as
green bonds, through which investors can more easily invest in the energy transition. In addition,
community-based finance can help lower the overall cost of borrowing for the transition, while
simultaneously facilitating the involvement of society in the transition.
n
Creating stable and predictable regulatory frameworks and market conditions for investment in
clean energy is a key measure to facilitate the reallocation of capital toward low-carbon solutions
and to minimise the spectre of stranded assets and avoid long-term lock-in into a carbon intensive
energy system.
n
While public investment has a role to play, public finance should also be used to help mitigate
key risks and to lower the cost of capital in countries and regions perceived as high risk. This
can contribute to correct some of the potentially negative GDP impacts on these countries and
regions.
n
Reducing crowding out of capital from the assumed rate of 50% to 0% produces an improvement
of 60% in GDP and of 100% in employment outcomes. At the global level, the assumed 50%
crowding is a very conservative assumption in the current context. But there are important
regional variations. Expected higher rates of crowding out in poorer regions could result in
increasing inequality during the energy transition.
n
Carbon taxes, together with the elimination of fossil fuel subsidies, not only provide important
signals to the market in favor of decarbonisation of the economy, but can also generate significant
additional revenue flows. These flows could be used to boost investments in renewable energy
and energy efficiency, align infrastructure and the general economy better with climate goals, or
be deployed in support of a fair transition strategy.
FOCUS AREA 6. ENSURE THAT TRANSITION COSTS AND BENEFITS
ARE FAIRLY DISTRIBUTED
Although the energy transition promises significant overall GDP, employment and welfare benefits
compared to the Reference Case, this cannot be considered in isolation of the socio-economic
system of which it is part and which it reshapes. These interactions determine the transition
outcome. Different pathways are possible, dependent on the level of ambition, on how targets are
translated into specific policy actions, and on the resulting dynamics and synergies.
However, irrespective of the particular pathway followed, different countries and regions will clearly
fare differently during the transition. This is a result of several factors, beginning with diverging
levels of ambition among countries. But the outcomes also relate strongly to underlying structural
realities and the degree to which governments undertake actions such as implementing carbon tax
systems in order to guide economies toward a low-carbon future. The analysis in this report finds
that countries as diverse as South Africa, as well as nations in Western Europe and the rest of East
Asia, can reap substantial GDP, welfare and employment gains relative to the Reference Case.
On the other hand, economies that strongly depend on fossil fuel exports will face considerable
challenges during the transition, especially if adjustment efforts are limited or undertaken with
delay. Worldwide, many fossil fuel jobs will be lost, even as a larger number of jobs are created
in renewable energy and energy efficiency. In particular, the REmap Case analysis finds that oil
exporters in the Middle East, parts of Africa, and the Russian Federation will have less GDP and
employment growth in the energy transition than under business as usual.
HOW TO FOSTER THE GLOBAL ENERGY TRANSFORMATION
72

The capability of a country or region to reap the GDP, employment and welfare benefits of the
transition also depends to a large extent on the degree to which domestic supply chains can
respond to new economic demand patterns stimulated by the transition. Countries with well-
developed industries and service sectors will benefit significantly more than those that depend
heavily on imported inputs.
As a result of diverging economic structures, the energy transition will generate uneven outcomes.
The REmap analysis focuses on the national and regional levels, but within a given national economy
particular areas will also fare better or worse, depending on their socio-economic structure.
This cannot be considered solely as a matter of overall employment numbers. The geographic
distribution of jobs gained and lost may not be in alignment. Similarly, new job creation may not
occur within the same time scale as jobs losses, requiring additional adjustment measures.
It is against this backdrop that the concept of a just and fair transition assumes great importance.
Spreading the benefits of the transition widely and limiting any resulting socio-economic difficulties
is essential not just as a matter of fundamental fairness, but also to limit the likelihood that those
negatively impacted will oppose policies required to render the world’s economies climate-safe. A
transition can be just if it entails policies to support needed economic restructuring.
A transition can be regarded as fair to the degree that it also seeks to reduce historical divergences
in levels of energy access. Universal energy access is in fact a key component of a fair and just
transition. Beyond energy access, huge disparities exist in the energy services available in different
regions. The transition process will only be complete when energy services converge in all regions.
n
Just transition entails a number of policies, and the mix of policies that are needed will vary from
country to country. It includes a set of industrial policies that support the creation of domestic
supply chains capable of responding to the economic dynamic triggered by the transition.
Governments can do so through tools such as providing preferential access to credit, land and
buildings, but also through the formation of economic incubators and industry clusters. Public
investments can stimulate the diversification of the economy as needed.
n
Another critical element concerns education and training policies, including an assessment of the
occupational patterns and skill profiles in rising and declining industries, and how workers might
most successfully be retrained. Because reskilling and other adjustments take time and are not
always certain to succeed, there is also a need to provide interim support, such as unemployment
insurance and other social protection measures.
n
From the perspective of ensuring a fair transition, adjustment challenges need to be considered
beyond urban, industrialised settings, with wider energy access and convergence considerations
being factored into energy transition scenarios and planning. In particular, these considerations
need to be an explicit part of any socio-economic footprint evaluation of transition roadmaps.
n
From the outset, governments need to
approach just transition in ways that explain
the specific implications at micro and macro
levels. A central goal of a just transition policy
must be to create structures that enable
individuals, communities and regions that have
been trapped in a fossil fuel energy system to
participate in the benefits of the transition.
HOW TO FOSTER THE GLOBAL ENERGY TRANSFORMATION
73

REFERENCES
REFERENCES
50Hertz (n.d.), 50Hertz - Reliable power supply to more
than 18 million people. http://www.50hertz.com/en/
(accessed 2.1.18).
Akinci, O., Olmstead-Rumsey, J. (2018), How effective
are macroprudential policies? An empirical investigation,
Journal of Financial Intermediation, volume 33, pages
33–57. https://doi.org/10.1016/j.jfi.2017.04.001
Campiglio, E. (2016), Beyond carbon pricing: The role of
banking and monetary policy in financing the transition
to a low-carbon economy, Ecological Economics,
volume 121, pages 220–230. http://dx.doi.org/10.1016/j.
ecolecon.2015.03.020
Cerutti, E., Claessens, S., Laeven, L. (2017), The use and
effectiveness of macroprudential policies: New evidence,
Journal of Financial Stability volume 28, pages 203–224.
https://doi.org/10.1016/j.jfs.2015.10.004
Coady, D., Parry, I.W.H., Sears, L., Shang, B. (2015), How
Large Are Global Energy Subsidies?, IMF Working Paper.
Washington D.C.
Frankfurt School-UNEP Centre, BNEF (2018), Global
trends in renewable energy investment 2018, Frankfurt
School of Finance & Management, Frankfurt am Main.
IEA (2018a), Global Energy & CO
2
Status Report 2017,
International Energy Agency (IEA), Paris.
IEA (2018b), Perspectives for the Energy Transition: The
role of Energy Efficiency, International Energy Agency
(IEA), Paris.
IEA (2017), World Energy Outlook 2017, International
Energy Agency (IEA), Paris, France.
IEA (2015),
World Energy Balances 2015 edition (Data-
base), International Energy Agency (IEA), Paris.
IEA and IRENA (2017), Perspectives for the energy
transition: Investment needs for a low-carbon energy
system, International Energy Agency (IEA) and
International Renewable Energy Agency (IRENA),
Abu Dhabi.
IRENA (2018a), Renewable Capacity Statistics 2018.
International Renewable Energy Agency (IRENA),
Abu Dhabi.
IRENA (2018b), New Global Commission to Examine
Geopolitics of Energy Transformation. http://www.irena.
org/newsroom/pressreleases/2018/Jan/New-Global-
Commission-to-Examine-Geopolitics-of-Energy-
Transformation (accessed 1.15.18).
IRENA (2018c), Renewable Power Generation Costs in
2017, International Renewable Energy Agency (IRENA),
Abu Dhabi.
IRENA (2018d), Renewable Energy Benefits: Leveraging
Local Capacity for Offshore Wind, International
Renewable Energy Agency (IRENA), Abu Dhabi.
IRENA (2017a), Accelerating the Energy Transition
through Innovation, International Renewable Energy
Agency (IRENA), Abu Dhabi.
IRENA (2017b), Stranded Assets and Renewables:
How the energy transition affects the value of energy
reserves, buildings and capital stock, International
Renewable Energy Agency (IRENA), Abu Dhabi.
IRENA (2017c), Synergies between renewable energy
and energy efficiency, International Renewable Energy
Agency (IRENA), Abu Dhabi.
IRENA (2017d), Renewable Energy and Jobs- Annual
Review 2017, International Renewable Energy Agency
(IRENA), Abu Dhabi.
IRENA (2017e) Untapped potential for climate action:
Renewable energy in Nationally Determined Contributions,
International Renewable Energy Agency (IRENA),
Abu Dhabi.
IRENA (2017f), Renewable Energy Benefits: Leveraging
Local Capacity for Solar PV, International Renewable
Energy Agency (IRENA) and Lawrence Berkeley
National Laboratory (LBNL), Abu Dhabi.
IRENA (2017g), Renewable Energy Benefits: Leveraging
Local Capacity for Onshore Wind, International
Renewable Energy Agency (IRENA), Abu Dhabi.
IRENA (2017h), Renewable Energy Benefits: Leveraging
Local Industries, International Renewable Energy Agency
(IRENA), Abu Dhabi.
IRENA (2016), Renewable Energy Benefits: Measuring
the Economics, International Renewable Energy Agency
(IRENA), Abu Dhabi.
IRENA & CPI (2018), Global landscape of renewable energy
finance 2018, International Renewable Energy Agency
(IRENA) and Climate Policy Institute (CPI), Abu Dhabi.
Lange, G.-M., Wodon, Q., Carey, K. (2018), The Changing
Wealth of Nations 2018: Building a Sustainable Future,
World Bank, Washington D.C.
74

Pollitt, H., Mercure, J.-F. (2018), The role of money
and the financial sector in energy-economy
models used for assessing climate and energy
policy, Climate Policy volume 18, pages 184–197.
https://doi.org/10.1080/14693062.2016.1277685
SE4ALL (2016), 2015 SEforALL Global Tracking
Framework, Sustainable Energy for All (SE4ALL).
http://gtf.esmap.org/data/files/download-
documents/gtf-2105-full-report.pdf (accessed
2.11.16).
Spiegel (2018), Neuzulassungen: Erstmals mehr
als eine Million E-Autos (New Registrations:
First time more than one Million Electric
Vehicles). http://www.spiegel.de/auto/aktuell/e-
mobilitaet-erstmals-ueber-eine-million-e-autos-
zugelassen-a-1197636.html (accessed 1.2.18)
Zhang, L., Zoli, E. (2014), Leaning Against the
Wind: Macroprudential Policy in Asia (IMF
Working Papers), International Monetary Fund
(IMF), Washington D.C.
PICTURE CREDITS
Page 10: Giant rotors of wind turbine; © Rudmer Zwerver/
shutterstock | Page 11: Four wind turbines turn under a blue sky
dotted with clouds; © allou/iStock | Page 15: Power Generating
Windmills; © real444/iStock | Page 17: Wind turbine park and
solar collectors © ollo/iStock | Page 17, right: Central home
energy storage battery unit © Petrmalinak/shutterstock | Page
20: Agricultural fields in Normandy, France; © Sergey Molchenko/
shutterstock | Page 25, left: Engineers checking outdoor solar
PV area; © xieyuliang/shutterstock | Page 25, right: close-up
of LED panel; © Yuthana Choradet Ness/shutterstock Page 26,
left: Wood pellets in container © Budimir Jevtic | Page 26, right:
Electrical car charging; © shutterstock | Page 43, top: A modern
factory producing components for wind farm farms in Szczecin,
Poland; © Mike Mareen/shutterstock | Page 43, left: Smart home
© shutterstock | Page 43, right: Hydrogen fuel cell © shutterstock
| Page 46: Willowmore, South Africa; © Grobler du Preez/
shutterstock | Page 49: Solar plant field; © Panumas Yanuthai/
shutterstock | Page 51: Workers throw oil palm fruit branch to the
truck in Nakorn Sri Thammarat, Thailand; © wattana/shutterstock
| Page 53, left: Solar photovoltaic inspection engineer; ©
xieyuliang/shutterstock | Page 53, right: Offshore wind farm
construction; © Natascha Kaukorat/shutterstock | Page 54, top:
Nyaungshwe, Myanmar; © Dietmar Temps/shutterstock | Page
54, center: Mangrove tree; © Damsea/shutterstock | Page 54,
bottom: Construction crews on site; © Red ivory/shutterstock |
Page 55: Engineer checking solar panel at solar power plant; ©
Monthira/shutterstock | Page 56: Kids at elementary school; ©
Rawpixel.com/shutterstock | Page 59: Cape Town, South Africa;
© Daniel S Edwards/shutterstock | Page 63: Left and right turn
traffic signs; © Pattakorn Uttarasak/shutterstock | Page 65:
Electrician working on high voltage power lines, Johannesburg,
South Africa; © The Light Writer 33/shutterstock | Page 67: Wind
turbine blades storage; © oleandra/shutterstock | Page 69, left:
Wind power plant concept; © chombosan/shutterstock | Page
69, right: Circuit board; © Your lucky photo/shutterstock | Page
70, left: Apartments with solar panels in South Korea; © sungsu
han/shutterstock | Page 70, right: Power supply for charging of
an electric car; © Seksan 99/shutterstock | Page 73: Boy holding
yellow pinwheel on green field; © Zaitsava Olga/shutterstock
75

www.irena.org
Copyright © IRENA 2018
